Acta Agriculturae Zhejiangensis ›› 2026, Vol. 38 ›› Issue (2): 248-257.DOI: 10.3969/j.issn.1004-1524.20250508
• Horticultural Science • Previous Articles Next Articles
Indicator screening and model development for evaluating pumpkin fruit quality
LIU Jing1( ), WANG Jian2, HUANG Yu1, WU Xiaohua2, GUO Xuanhe1, WANG Ying2, LI Guojing2, XU Xiaojiang1,*()
1. Shaoxing Academy of Agricultural Sciences Shaoxing 312003, Zhejiang, China 2. Institute of Vegetables ,Zhejiang Academy of Agricultural Sciences Hangzhou 310021, China
-
Received:2025-07-25Online:2026-02-25Published:2026-03-24
CLC Number:
Cite this article
LIU Jing, WANG Jian, HUANG Yu, WU Xiaohua, GUO Xuanhe, WANG Ying, LI Guojing, XU Xiaojiang. Indicator screening and model development for evaluating pumpkin fruit quality[J]. Acta Agriculturae Zhejiangensis, 2026, 38(2): 248-257.
share this article
Add to citation manager EndNote|Ris|BibTeX
URL: http://www.zjnyxb.cn/EN/10.3969/j.issn.1004-1524.20250508
| 感官指标 Sensory indicator | 评分范围Score range | ||
|---|---|---|---|
| 0~2 | 3~5 | 6~7 | |
| 柔软度Softness | 柔软Soft | 较硬Relative hard | 非常硬Very hard |
| 黏度Viscosity | 很黏Very viscous | 黏性一般Viscous | 不黏Not viscous |
| 干湿度Dryness/wetness | 口感干燥Dry taste | 口感较为潮湿Wet taste | 口感湿润潮湿Very wet taste |
| 纤维感Fibrous texture | 光滑、无纤维感Smooth, no fibrous feeling | 中度纤维感Moderate fibrous feeling | 纤维感强Strong fibrous feeling |
| 甜度Sweetness | 无甜味Not sweet | 较甜Sweet | 非常甜Very sweet |
Table 1 Sensory evaluation indicators and scoring criteria for pumpkin fruit
| 感官指标 Sensory indicator | 评分范围Score range | ||
|---|---|---|---|
| 0~2 | 3~5 | 6~7 | |
| 柔软度Softness | 柔软Soft | 较硬Relative hard | 非常硬Very hard |
| 黏度Viscosity | 很黏Very viscous | 黏性一般Viscous | 不黏Not viscous |
| 干湿度Dryness/wetness | 口感干燥Dry taste | 口感较为潮湿Wet taste | 口感湿润潮湿Very wet taste |
| 纤维感Fibrous texture | 光滑、无纤维感Smooth, no fibrous feeling | 中度纤维感Moderate fibrous feeling | 纤维感强Strong fibrous feeling |
| 甜度Sweetness | 无甜味Not sweet | 较甜Sweet | 非常甜Very sweet |
| 栽培种 Cultivar | 含水量/% Moisture content/% | 纤维素含量/ (mg·g-1) Cellulose content/ (mg·g-1) | 可溶性糖含量/ (mg·g-1) Soluble sugar content/ (mg·g-1) | 淀粉含量/ (mg·g-1) Starch content/ (mg·g-1) | 直链淀粉含量/ (mg·g-1) Amylose content/ (mg·g-1) | β-胡萝卜素含量/ (μg·g-1) β-Carotene content/ (μg·g-1) | 柔软度 Softness | 黏度 Viscosity | 干湿度 Dryness/ wetness | 纤维感 Fibrous texture | 甜度 Sweetness |
|---|---|---|---|---|---|---|---|---|---|---|---|
| 印度南瓜 | 79.43 | 3.41 | 9.83 | 57.66 | 11.62 | 27.10 | 5.00 | 4.35 | 4.81 | 4.91 | 3.32 |
| Cucurbita maxima | |||||||||||
| 中国南瓜 | 89.54*** | 5.03*** | 26.57*** | 22.84*** | 5.86*** | 43.49*** | 5.13ns | 3.41** | 3.65*** | 3.47*** | 3.79* |
| Cucurbita moschata |
Table 2 Differences in quality indicators between Cucurbita maxima and Cucurbita moschata
| 栽培种 Cultivar | 含水量/% Moisture content/% | 纤维素含量/ (mg·g-1) Cellulose content/ (mg·g-1) | 可溶性糖含量/ (mg·g-1) Soluble sugar content/ (mg·g-1) | 淀粉含量/ (mg·g-1) Starch content/ (mg·g-1) | 直链淀粉含量/ (mg·g-1) Amylose content/ (mg·g-1) | β-胡萝卜素含量/ (μg·g-1) β-Carotene content/ (μg·g-1) | 柔软度 Softness | 黏度 Viscosity | 干湿度 Dryness/ wetness | 纤维感 Fibrous texture | 甜度 Sweetness |
|---|---|---|---|---|---|---|---|---|---|---|---|
| 印度南瓜 | 79.43 | 3.41 | 9.83 | 57.66 | 11.62 | 27.10 | 5.00 | 4.35 | 4.81 | 4.91 | 3.32 |
| Cucurbita maxima | |||||||||||
| 中国南瓜 | 89.54*** | 5.03*** | 26.57*** | 22.84*** | 5.86*** | 43.49*** | 5.13ns | 3.41** | 3.65*** | 3.47*** | 3.79* |
| Cucurbita moschata |
| 指标 Quality indicators | 平均值 Average | 最大值 Maximum | 最小值 Minimum | 标准差 Standard deviation | 变异系数 Coefficient of variation/% |
|---|---|---|---|---|---|
| 含水量/%Moisture content/% | 82.92 | 97.54 | 68.53 | 7.46 | 9.00 |
| 纤维素含量/(mg·g-1)Cellulose content/(mg·g-1) | 3.97 | 14.12 | 1.72 | 1.81 | 45.59 |
| 可溶性糖含量/(mg·g-1)Soluble sugar content/(mg·g-1) | 15.60 | 43.12 | 1.83 | 10.77 | 69.04 |
| 淀粉含量/(mg·g-1)Starch content/(mg·g-1) | 45.65 | 84.00 | 3.23 | 23.96 | 52.49 |
| 直链淀粉含量/(mg·g-1)Amylose content/(mg·g-1) | 9.64 | 22.03 | 0.77 | 5.22 | 54.18 |
| β-胡萝卜素含量/(μg·g-1) β-Carotene content/(μg·g-1) | 32.75 | 64.98 | 13.97 | 12.61 | 38.49 |
| 柔软度Softness | 5.34 | 6.80 | 2.80 | 0.95 | 17.80 |
| 黏度Viscosity | 4.04 | 7.00 | 0.60 | 1.48 | 36.64 |
| 干湿度Dryness/wetness | 4.01 | 7.20 | 0.70 | 1.43 | 35.66 |
| 纤维感Fibrous texture | 4.53 | 7.06 | 1.20 | 1.34 | 29.59 |
| 甜度Sweetness | 3.41 | 6.40 | 0.08 | 1.33 | 38.84 |
Table 3 Statistical analysis of pumpkin fruit quality indicators
| 指标 Quality indicators | 平均值 Average | 最大值 Maximum | 最小值 Minimum | 标准差 Standard deviation | 变异系数 Coefficient of variation/% |
|---|---|---|---|---|---|
| 含水量/%Moisture content/% | 82.92 | 97.54 | 68.53 | 7.46 | 9.00 |
| 纤维素含量/(mg·g-1)Cellulose content/(mg·g-1) | 3.97 | 14.12 | 1.72 | 1.81 | 45.59 |
| 可溶性糖含量/(mg·g-1)Soluble sugar content/(mg·g-1) | 15.60 | 43.12 | 1.83 | 10.77 | 69.04 |
| 淀粉含量/(mg·g-1)Starch content/(mg·g-1) | 45.65 | 84.00 | 3.23 | 23.96 | 52.49 |
| 直链淀粉含量/(mg·g-1)Amylose content/(mg·g-1) | 9.64 | 22.03 | 0.77 | 5.22 | 54.18 |
| β-胡萝卜素含量/(μg·g-1) β-Carotene content/(μg·g-1) | 32.75 | 64.98 | 13.97 | 12.61 | 38.49 |
| 柔软度Softness | 5.34 | 6.80 | 2.80 | 0.95 | 17.80 |
| 黏度Viscosity | 4.04 | 7.00 | 0.60 | 1.48 | 36.64 |
| 干湿度Dryness/wetness | 4.01 | 7.20 | 0.70 | 1.43 | 35.66 |
| 纤维感Fibrous texture | 4.53 | 7.06 | 1.20 | 1.34 | 29.59 |
| 甜度Sweetness | 3.41 | 6.40 | 0.08 | 1.33 | 38.84 |
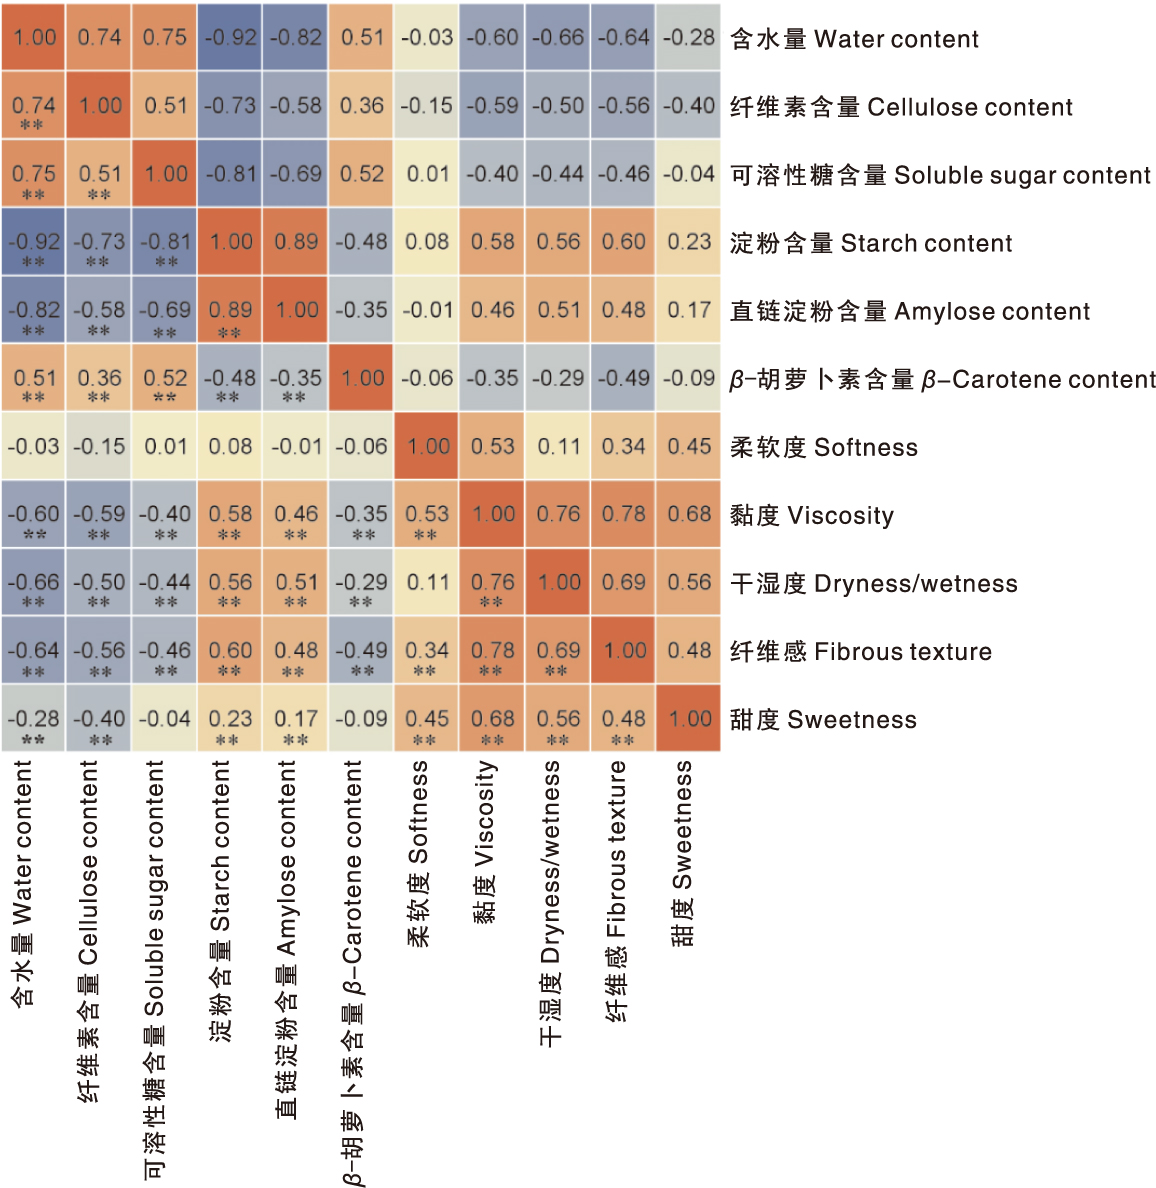
Fig.1 Correlation among pumpkin quality traits Red indicates a positive correlation between two quality indicators, where a darker color and larger value signify a stronger positive correlation; blue indicates a negative correlation between two quality indicators, where a darker color and smaller value signify a stronger negative correlation.
| 指标Indicators | F1 | F2 | F3 | F4 | F5 |
|---|---|---|---|---|---|
| 含水量Moisture content | -0.808 6 | -0.333 9 | 0.238 9 | 0.048 7 | 0.302 2 |
| 纤维素含量Cellulose content | -0.488 6 | -0.297 4 | 0.158 3 | -0.063 8 | 0.769 6 |
| 可溶性糖含量Soluble sugar content | -0.850 3 | -0.088 4 | 0.319 6 | -0.049 4 | -0.034 3 |
| 淀粉含量Starch content | 0.886 7 | 0.230 5 | -0.198 9 | 0.067 5 | -0.270 9 |
| 直链淀粉含量Amylose content | 0.889 8 | 0.203 6 | -0.023 1 | -0.019 1 | -0.166 6 |
| β-胡萝卜素含量β-Carotene content | -0.266 1 | -0.100 4 | 0.931 2 | -0.012 7 | 0.100 4 |
| 柔软度Softness | -0.019 5 | 0.211 8 | -0.019 8 | 0.964 6 | -0.030 9 |
| 黏度Viscosity | 0.389 0 | 0.724 7 | -0.188 4 | 0.407 8 | -0.166 5 |
| 干湿度Dryness/wetness | 0.454 6 | 0.837 2 | -0.103 7 | -0.097 8 | 0.006 1 |
| 纤维感Fibrous texture | 0.427 1 | 0.616 3 | -0.414 7 | 0.236 6 | -0.092 6 |
| 甜度Sweetness | -0.049 9 | 0.805 3 | 0.046 5 | 0.298 5 | -0.315 6 |
Table 4 Rotated factor loading values of pumpkin fruit quality indicators
| 指标Indicators | F1 | F2 | F3 | F4 | F5 |
|---|---|---|---|---|---|
| 含水量Moisture content | -0.808 6 | -0.333 9 | 0.238 9 | 0.048 7 | 0.302 2 |
| 纤维素含量Cellulose content | -0.488 6 | -0.297 4 | 0.158 3 | -0.063 8 | 0.769 6 |
| 可溶性糖含量Soluble sugar content | -0.850 3 | -0.088 4 | 0.319 6 | -0.049 4 | -0.034 3 |
| 淀粉含量Starch content | 0.886 7 | 0.230 5 | -0.198 9 | 0.067 5 | -0.270 9 |
| 直链淀粉含量Amylose content | 0.889 8 | 0.203 6 | -0.023 1 | -0.019 1 | -0.166 6 |
| β-胡萝卜素含量β-Carotene content | -0.266 1 | -0.100 4 | 0.931 2 | -0.012 7 | 0.100 4 |
| 柔软度Softness | -0.019 5 | 0.211 8 | -0.019 8 | 0.964 6 | -0.030 9 |
| 黏度Viscosity | 0.389 0 | 0.724 7 | -0.188 4 | 0.407 8 | -0.166 5 |
| 干湿度Dryness/wetness | 0.454 6 | 0.837 2 | -0.103 7 | -0.097 8 | 0.006 1 |
| 纤维感Fibrous texture | 0.427 1 | 0.616 3 | -0.414 7 | 0.236 6 | -0.092 6 |
| 甜度Sweetness | -0.049 9 | 0.805 3 | 0.046 5 | 0.298 5 | -0.315 6 |
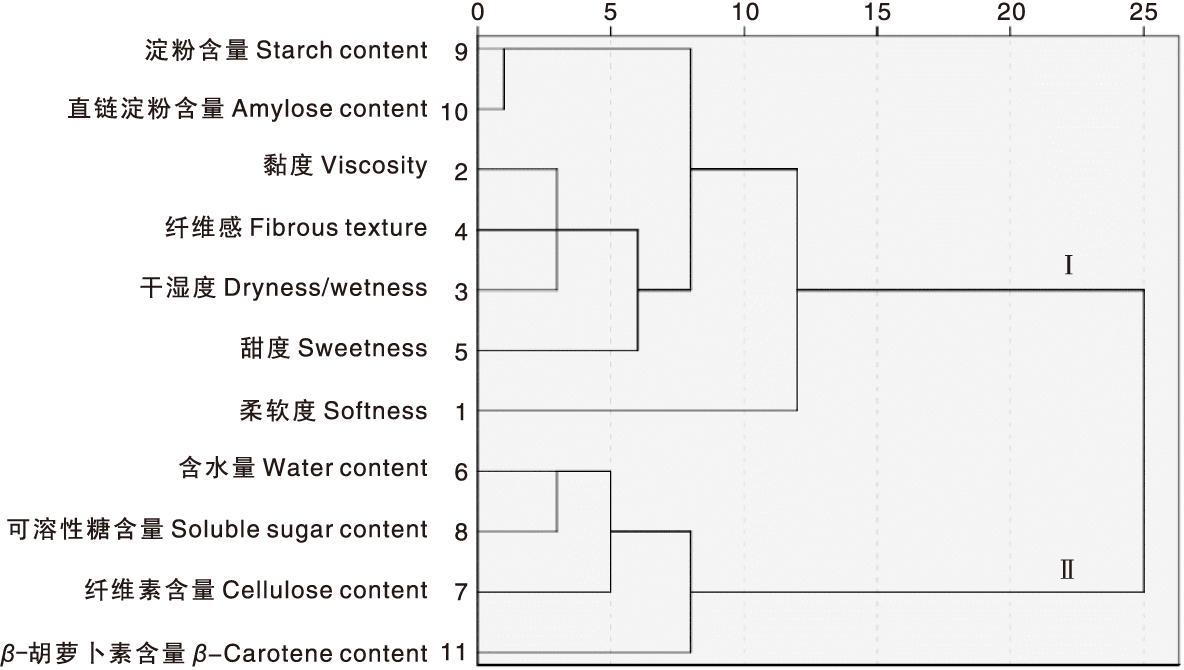
Fig.2 Cluster analysis of pumpkin quality traits
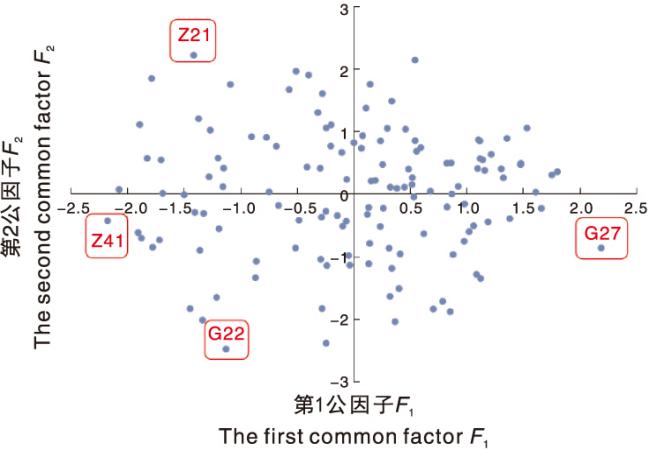
Fig.3 Scatter plot distribution of 146 pumpkin accessions based on the first common factor and the second common factor
| [1] | 黄峰华, 李晓晨, 王敏, 等. 中国南瓜产业优势及贸易竞争力分析[J]. 农业展望, 2023, 19(11): 87-94. |
| HUANG F H, LI X C, WANG M, et al. Analysis on China’s industry advantages and trade competitiveness of pumpkin[J]. Agricultural Outlook, 2023, 19(11): 87-94. | |
| [2] | 李俊星, 钟玉娟, 罗文龙, 等. 广东南瓜的品种改良及发展[J]. 中国瓜菜, 2019, 32(2): 50-52. |
| LI J X, ZHONG Y J, LUO W L, et al. Variety improvement and development of pumpkin in Guangdong[J]. China Cucurbits and Vegetables, 2019, 32(2): 50-52. | |
| [3] | 熊建华, 罗秋水, 闵嗣璠, 等. 蜜本南瓜不同部位营养成分分析与评价[J]. 湖北农业科学, 2009, 48(9): 2239-2241. |
| XIONG J H, LUO Q S, MIN S F, et al. Analysis and evaluation on the nutritional components in different parts of Miben pumpkin[J]. Hubei Agricultural Sciences, 2009, 48(9): 2239-2241. | |
| [4] | 任广乾, 杨世康, 卞世杰, 等. 基于相关性和主成分分析评价南瓜的营养品质[J]. 中国瓜菜, 2023, 36(6): 37-42. |
| REN G Q, YANG S K, BIAN S J, et al. Evaluation of pumpkin nutrient quality based on correlation and principal component analysis[J]. China Cucurbits and Vegetables, 2023, 36(6): 37-42. | |
| [5] | 杨宏, 李跃建, 王长林, 等. 南瓜口感评价与营养成分的相关性和回归分析[J]. 中国蔬菜, 2016(11): 25-32. |
| YANG H, LI Y J, WANG C L, et al. Correlation and regression analysis of pumpkin taste evaluation and nutritional components[J]. China Vegetables, 2016(11): 25-32. | |
| [6] | 闫春冬, 王云莉, 田金丽, 等. 肉用印度南瓜营养品质的简易鉴定方法[J]. 北方园艺, 2018(21): 76-80. |
| YAN C D, WANG Y L, TIAN J L, et al. A simple method for identifying nutritional quality of Indian pumpkin[J]. Northern Horticulture, 2018(21): 76-80. | |
| [7] | 鲍江峰, 夏仁学, 邓秀新, 等. 用主成分分析法选择纽荷尔脐橙品质的评价因素[J]. 华中农业大学学报, 2004, 23(6): 663-666. |
| BAO J F, XIA R X, DENG X X, et al. The quality evaluation factors selection of Newhall orange by the principal component analysis[J]. Journal of Huazhong Agricultural University, 2004, 23(6): 663-666. | |
| [8] | 张海英, 韩涛, 王有年, 等. 桃果实品质评价因子的选择[J]. 农业工程学报, 2006, 22(8): 235-239. |
| ZHANG H Y, HAN T, WANG Y N, et al. Selection of factors for evaluating peach(Prunus persica) fruit quality[J]. Transactions of the Chinese Society of Agricultural Engineering, 2006, 22(8): 235-239. | |
| [9] | 张淑文, 梁森苗, 郑锡良, 等. 杨梅优株果实品质的主成分分析及综合评价[J]. 果树学报, 2018, 35(8): 977-986. |
| ZHANG S W, LIANG S M, ZHENG X L, et al. Principal component analysis and comprehensive evaluation of fruit quality in some advanced selections of Chinese bayberry[J]. Journal of Fruit Science, 2018, 35(8): 977-986. | |
| [10] | 徐强, 刘进生, 陈学好, 等. 加工类型黄瓜品质性状的主成分及聚类分析[J]. 扬州大学学报, 2003, 24(4): 78-81. |
| XU Q, LIU J S, CHEN X H, et al. Principal component and cluster analysis of quality characters of pickling cucumber (Cucumis sativus L.)[J]. Journal of Yangzhou University, 2003, 24(4): 78-81. | |
| [11] | 王佳豪, 段雅倩, 乜兰春, 等. ‘羊角脆’类甜瓜果实品质因子分析及综合评价[J]. 中国农业科学, 2019, 52(24): 4582-4591. |
| WANG J H, DUAN Y Q, NIE L C, et al. Factor analysis and comprehensive evaluation of the fruit quality of ‘Yangjiaocui’ melons[J]. Scientia Agricultura Sinica, 2019, 52(24): 4582-4591. | |
| [12] | 汪颖, 王尖, 冯子珊, 等. 瓠瓜果实品质性状因子分析和综合评价[J]. 浙江农业学报, 2024, 36(2): 334-343. |
| WANG Y, WANG J, FENG Z S, et al. Factor analysis and comprehensive evaluation of the fruit quality of bottle gourd (Lagenaria siceraria)[J]. Acta Agriculturae Zhejiangensis, 2024, 36(2): 334-343. | |
| [13] | 尹玲, 王长林, 王迎杰, 等. 南瓜的感官品质、质构及生化分析[J]. 食品科学, 2013, 34(5): 26-30. |
| YIN L, WANG C L, WANG Y J, et al. Sensory quality, texture and chemical composition analysis of pumpkin[J]. Food Science, 2013, 34(5): 26-30. | |
| [14] | 高俊凤. 植物生理学实验指导[M]. 北京: 高等教育出版社, 2006. |
| [15] | 刘襄河, 郑丽璇, 郑丽勉, 等. 双波长法测定常用淀粉原料中直链淀粉、支链淀粉及总淀粉含量[J]. 广东农业科学, 2013, 40(18): 97-100. |
| LIU X H, ZHENG L X, ZHENG L M, et al. Determination of amylose and amylopectin in the commonly used starch materials by dual-wavelength spectrophotometry[J]. Guangdong Agricultural Sciences, 2013, 40(18): 97-100. | |
| [16] | 吴明隆. SPSS统计应用实务[M]. 北京: 中国铁道出版社, 2000. |
| [17] | 公丽艳, 孟宪军, 刘乃侨, 等. 基于主成分与聚类分析的苹果加工品质评价[J]. 农业工程学报, 2014, 30(13): 276-285. |
| GONG L Y, MENG X J, LIU N Q, et al. Evaluation of apple quality based on principal component and hierarchical cluster analysis[J]. Transactions of the Chinese Society of Agricultural Engineering, 2014, 30(13): 276-285. | |
| [18] | 杨鹏鸣, 李桂荣, 李孝伟, 等. 南瓜主要营养品质性状的变异及相关性研究[J]. 中国农学通报, 2006, 22(2): 285-288. |
| YANG P M, LI G R, LI X W, et al. Investigation on variation and correlation of pumpkin’s main quality traits[J]. Chinese Agricultural Science Bulletin, 2006, 22(2): 285-288. | |
| [19] | JUDITH M T, EMMANUEL Y, BALOGOUN I, et al. Agromorphological, chemical and biochemical characterization of pumpkin (Cucurbita maxima and Cucurbita moschata, Cucurbitaceae) morphotypes cultivated in Cameroon[J]. Research in Plant Sciences, 2015, 3(1): 12-17. |
| [20] | KISTLER L, NEWSOM L A, RYAN T M, et al. Gourds and squashes (Cucurbita spp.) adapted to megafaunal extinction and ecological anachronism through domestication[J]. Proceedings of the National Academy of Sciences of the United States of America, 2015, 112(49): 15107-15112. |
| [21] | XU Y C, WANG M M, ABBAS H M K, et al. Comparing the differences in quality profiles and antioxidant activity in seven pumpkin cultivars (Cucurbita moschata and Cucurbita maxima) at harvest and during postharvest storage[J]. Food Chemistry: X, 2024, 22: 101383. |
| [22] | 任晓婧. 印度南瓜淀粉和可溶性固形物含量性状的QTL定位分析[D]. 哈尔滨: 东北农业大学, 2021. |
| REN X J. QTL Mapping and analysis of starch and soluble solid content traits in pumpkin (Cucurbita maxima Duch.)[D]. Harbin: Northeast Agricultural University, 2021. | |
| [23] | 褚盼盼, 向长萍. 中国南瓜营养品质的变化规律和相关性[J]. 中国蔬菜, 2007(12): 15-19. |
| CHU P P, XIANG C P. Changes and correlation of nutritional quality of pumpkin in China[J]. China Vegetables, 2007(12): 15-19. |
| [1] | ZHANG Yue, WANG Jingran, ZHOU Qiang, CHEN Meiling, WANG Yanhong. Effects of exogenous spraying of folic acid on the folic acid content and quality of rice [J]. Acta Agriculturae Zhejiangensis, 2026, 38(2): 197-205. |
| [2] | OUYANG Yu, LIU Shuo, LI Mengmin, ZHANG Peng. Lightweight and improved apple orchard fruit recognition model CS_YOLOv7 [J]. Acta Agriculturae Zhejiangensis, 2026, 38(2): 383-396. |
| [3] | HE Suyue, LI Yan, DING Yunqian, LI Xinze, HAN Qinghui, CHEN Xiaoyang. Phylogenetic analysis of maize landraces in Zhejiang Province of China based on SSR markers [J]. Acta Agriculturae Zhejiangensis, 2026, 38(1): 24-34. |
| [4] | XU Weimeng, XU Yan, CHEN Guoli. Comprehensive evaluation of waxy corn quality based on various analytical methods [J]. Acta Agriculturae Zhejiangensis, 2025, 37(9): 1840-1848. |
| [5] | ZHU Weijing, WU Jia, HONG Chunlai, ZHU Fengxiang, HONG Leidong, ZHANG Tao, ZHANG Shuo, ZHU Huifen. Effects of straw mulching on water, heat, fertility status of soil and yield and quality of flat peach [J]. Acta Agriculturae Zhejiangensis, 2025, 37(9): 1924-1932. |
| [6] | HE Shixiong, YANG Lei, QI Anmin, CHENG Ji, WANG Min, LI Yingkui, HONG Lin. Effects of interstock on leaf photosynthetic characteristics, physicochemical properties and fruit quality of three mandarin hybrids [J]. Acta Agriculturae Zhejiangensis, 2025, 37(8): 1680-1693. |
| [7] | ZHANG Shunchang, XU Jigen, FU Chengyue, PU Zhanxu, HU Lipeng, WU Hao, LI Junbing, XIN Liang, LEI Yuanjun. Effect of amino acid calcium spraying on peel cracking and quality of citrus hybrid Hongmeiren [J]. Acta Agriculturae Zhejiangensis, 2025, 37(8): 1706-1715. |
| [8] | YAN Fulin, LANG Yunhu, JIAN Yingquan, CHEN Xiongfei, WEI Wei, WANG Zhiwei, AN Jiangyong, REN Deqiang, DING Ning, WEI Shenghua. Response of yield and quality of Radix Ardisia to soil physiochemical properties [J]. Acta Agriculturae Zhejiangensis, 2025, 37(8): 1766-1775. |
| [9] | FENG Yiyu, REN Hongjie. Quantitative assessment of new quality productive forces in China’s livestock industry: based on panel data in 2007-2021 [J]. Acta Agriculturae Zhejiangensis, 2025, 37(8): 1805-1816. |
| [10] | HUANG Xianke, HUANG Xiaolin, ZHANG Xiang, LI Min, CAI Yilong, CHEN Ran. Effects of oyster shells on the growth performance of Penaeus vannamei and water quality, and microbial community characteristics on shell surfaces [J]. Acta Agriculturae Zhejiangensis, 2025, 37(7): 1441-1450. |
| [11] | WANG Chengyang, LIU Jieya, WU Minyi, XIE Boyi, HONG Decheng, LENG Feng, WU Guoquan. Effect of calcium treatment on the fruit quality of Reliance grape under waterlogging [J]. Acta Agriculturae Zhejiangensis, 2025, 37(7): 1451-1458. |
| [12] | ZHANG Yuanyuan, LI Meng. The estimation of new quality productive forces level, developmental retardation and cultivation path of feed enterprises [J]. Acta Agriculturae Zhejiangensis, 2025, 37(7): 1580-1594. |
| [13] | ZHANG Ruonan, MEN Xiaoming, QIN Kaipeng, WANG Binbin, WU Jie, DING Xiangbin, XU Ziwei, QI Keke. Comparative study on growth performance, carcass quality, meat performance and profitability of different crossbreed combinations of Lvjiahei pigs [J]. Acta Agriculturae Zhejiangensis, 2025, 37(6): 1203-1211. |
| [14] | TAO Peng, DING Xiaoya, YUE Zhichen, ZHAO Yanting, LEI Juanli, HU Qizan, ZANG Yunxiang, LI Biyuan. Genome-wide association study and candidate gene prediction of pectin content of pumpkin (Cucurbita moschata) [J]. Acta Agriculturae Zhejiangensis, 2025, 37(6): 1244-1251. |
| [15] | XIANG Ying, CONG Jianmin, PAN Danhong, TAO Yonggang. Comprehensive evaluation of the growth process of different tomato varieties under spring organic greenhouse planting [J]. Acta Agriculturae Zhejiangensis, 2025, 37(6): 1252-1261. |
| Viewed | ||||||
|
Full text |
|
|||||
|
Abstract |
|
|||||
