浙江农业学报 ›› 2026, Vol. 38 ›› Issue (2): 339-350.DOI: 10.3969/j.issn.1004-1524.20250206
丽水市茶树碳储量和茶叶产品碳足迹研究
董瑞丽1( ), 顾蕾2, 张梦1, 周国模1,*()
1.浙江农林大学 环境与资源学院 ,碳中和学院 浙江 杭州 311300 2.浙江农林大学 经济管理学院 浙江 杭州 311300
-
收稿日期:2025-03-20出版日期:2026-02-25发布日期:2026-03-24 -
作者简介:董瑞丽,研究方向为农林产品碳足迹。E-mail:1546615739@qq.com -
通讯作者:*周国模,E-mail:zhougm@zafu.edu.cn -
基金资助:浙江省“尖兵”“领雁”研发攻关计划(2022C03039);浙江省“三农九方”科技协作计划项目(2024SNJF031)
Research on carbon storage of tea trees and carbon footprint of tea products in Lishui City, Zhejiang Province, China
DONG Ruili1(), GU Lei2, ZHANG Meng1, ZHOU Guomo1,*()
1. College of Environment and Resources ,College of Carbon Neutrality, Zhejiang A&F University Hangzhou 311300, China 2. College of Economics and Management ,Zhejiang A&F University Hangzhou 311300, China
-
Received:2025-03-20Published:2026-02-25Online:2026-03-24
摘要:
科学合理地评估茶叶产品碳足迹有助于促进环境保护,推动茶业可持续发展。本研究旨在通过建立茶树生物量估算模型,计算茶树在种植经营阶段的碳汇量,并结合茶叶在生产加工和分销运输过程中的碳排放量,评估茶叶从“摇篮到大门”的生命周期碳足迹,以估算丽水市2015—2023年茶叶产品的碳排放量。结果表明:茶树地上生物量、地下生物量和总生物量模型决定系数(R2)均高于0.80;茶树年均碳储量效益平均为10.57 kg·kg-1(以CO2排放当量计,CO2-eq);茶叶产品平均碳足迹为0.49 kg·kg-1(以CO2-eq计);2015—2023年丽水市茶叶产品生产的平均碳排放量为2 133 t(以CO2-eq计),平均碳排放强度分别为0.41 t·hm-2。茶树年均碳储量效应高于茶园经营阶段碳排放量,茶树碳储量效应在茶叶产品碳足迹评估中有着重要的作用;2015—2023年丽水市茶叶产品碳排放量呈逐年上升趋势,松阳、遂昌碳排放强度最高。本研究结果可为相关研究提供思路,为茶叶低碳生产提供理论依据。
中图分类号:
引用本文
董瑞丽, 顾蕾, 张梦, 周国模. 丽水市茶树碳储量和茶叶产品碳足迹研究[J]. 浙江农业学报, 2026, 38(2): 339-350.
DONG Ruili, GU Lei, ZHANG Meng, ZHOU Guomo. Research on carbon storage of tea trees and carbon footprint of tea products in Lishui City, Zhejiang Province, China[J]. Acta Agriculturae Zhejiangensis, 2026, 38(2): 339-350.
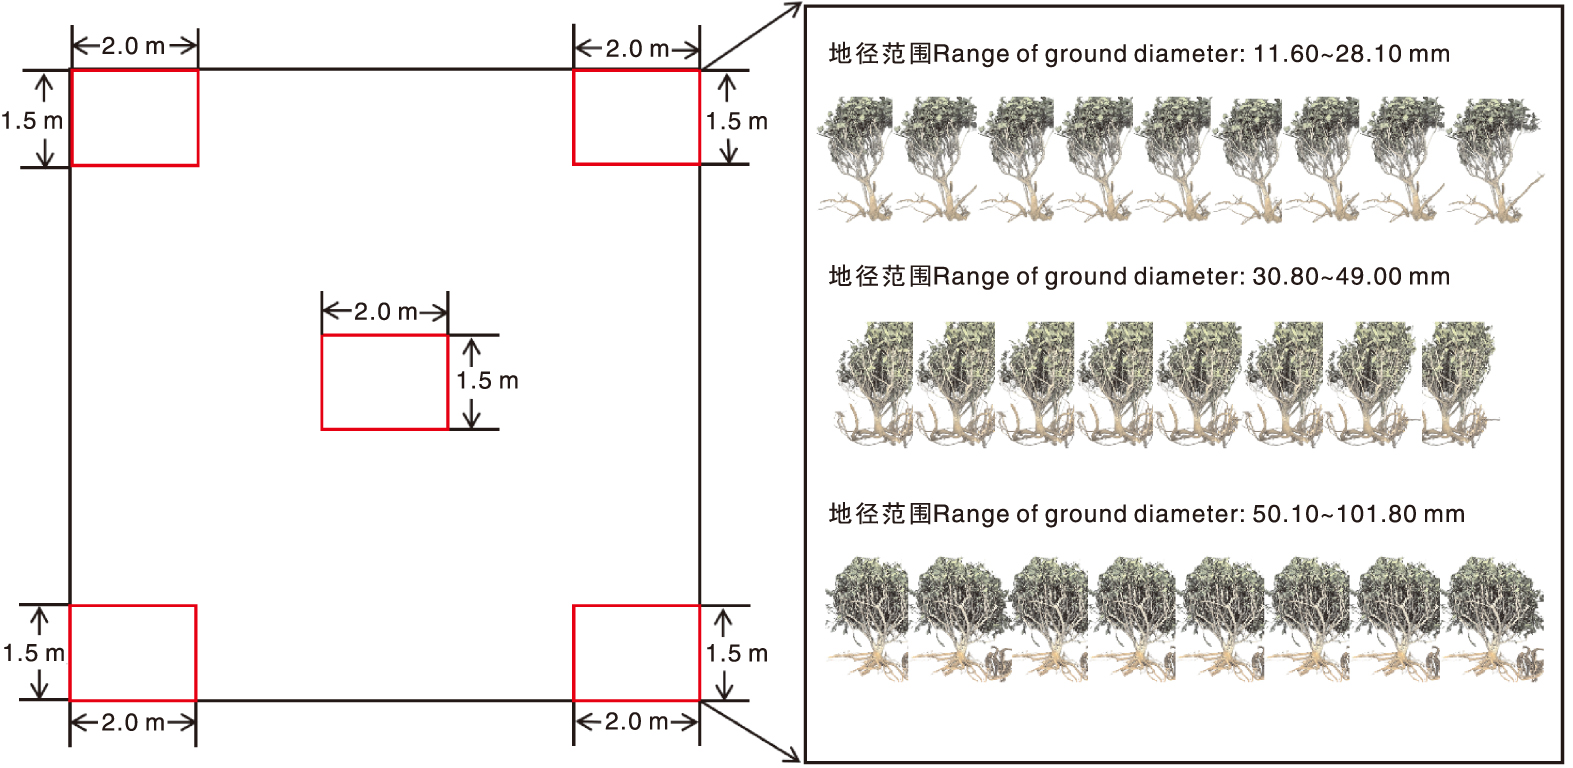
图1 样方设计与样木选择示意图
Fig.1 Schematic diagram of sample plot design and sample tree selection
| 样地编号 Plot number | 茶树类型 Tree type | 株数 Number of trees | 平均地径/mm Average ground diameter/mm |
|---|---|---|---|
| 样地1 | 小Small | 6 | 32.78 |
| Plot 1 | 中Middle | ||
| 大Big | |||
| 样地2 | 小Small | 6 | 44.02 |
| Plot 2 | 中Middle | ||
| 大Big | |||
| 样地3 | 小Small | 6 | 40.82 |
| Plot 3 | 中Middle | ||
| 大Big | |||
| 样地4 | 小Small | 6 | 41.85 |
| Plot 4 | 中Middle | ||
| 大Big |
表1 样地基本信息
Table 1 Basic information of the plots
| 样地编号 Plot number | 茶树类型 Tree type | 株数 Number of trees | 平均地径/mm Average ground diameter/mm |
|---|---|---|---|
| 样地1 | 小Small | 6 | 32.78 |
| Plot 1 | 中Middle | ||
| 大Big | |||
| 样地2 | 小Small | 6 | 44.02 |
| Plot 2 | 中Middle | ||
| 大Big | |||
| 样地3 | 小Small | 6 | 40.82 |
| Plot 3 | 中Middle | ||
| 大Big | |||
| 样地4 | 小Small | 6 | 41.85 |
| Plot 4 | 中Middle | ||
| 大Big |
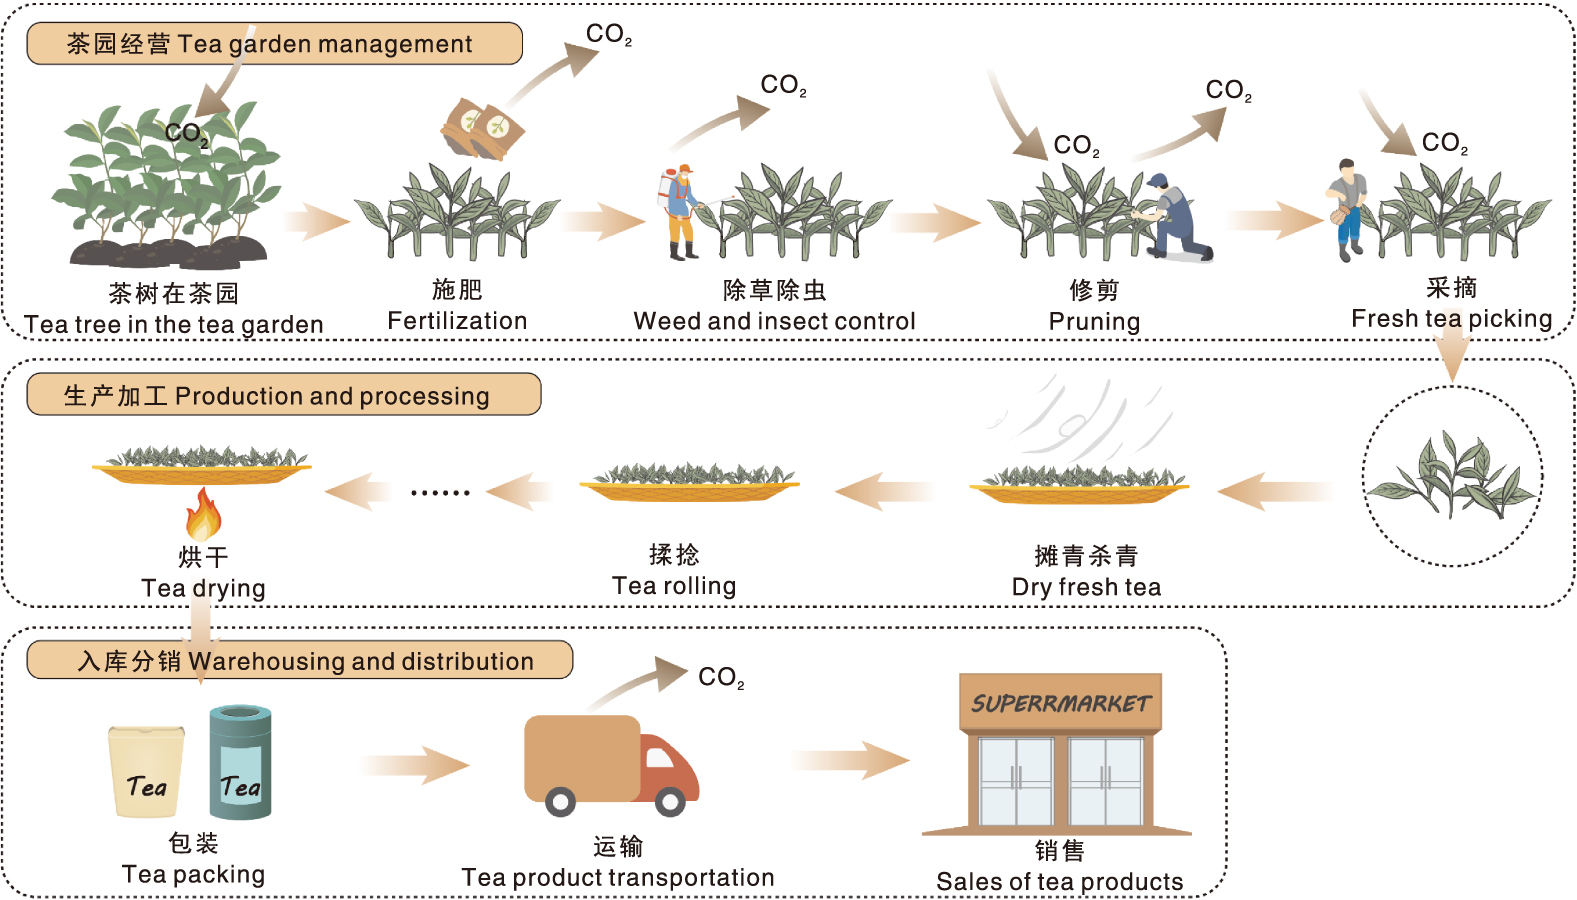
图2 茶叶产品碳足迹评估边界
Fig.2 Boundary of carbon footprint assessment for tea products
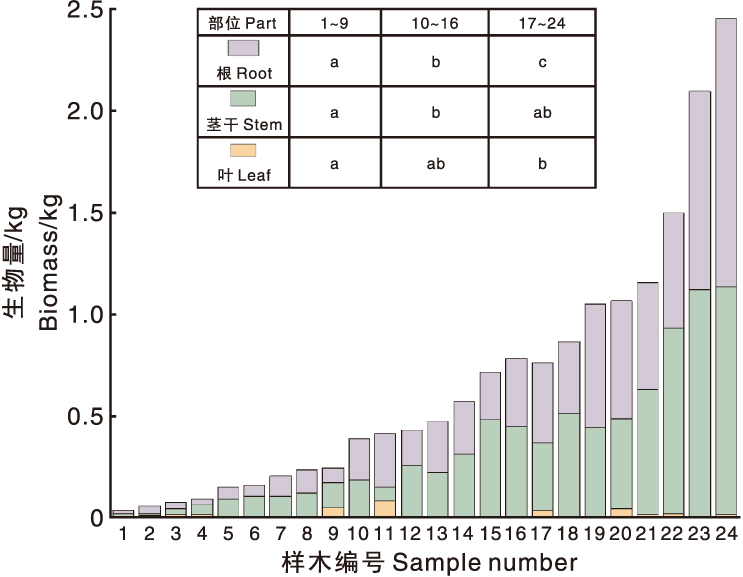
图3 不同地径茶树的生物量分配特征 样木1~9为小地径茶树,样木10~16为中地径茶树,样木17~24为大地径茶树。不同地径样木间(根/茎干/叶片)无相同字母的表示组间差异显著(p<0.05)。
Fig.3 Biomass allocation characteristics of tea plants with different ground diameters Samples 1-9, 10-16,17-24 are tea plants with small, medium and big ground diameter, respecitvely. Different letters indicate significant difference on root/stem/leaf within tea plant groups with varied gourd diamters at p<0.05.
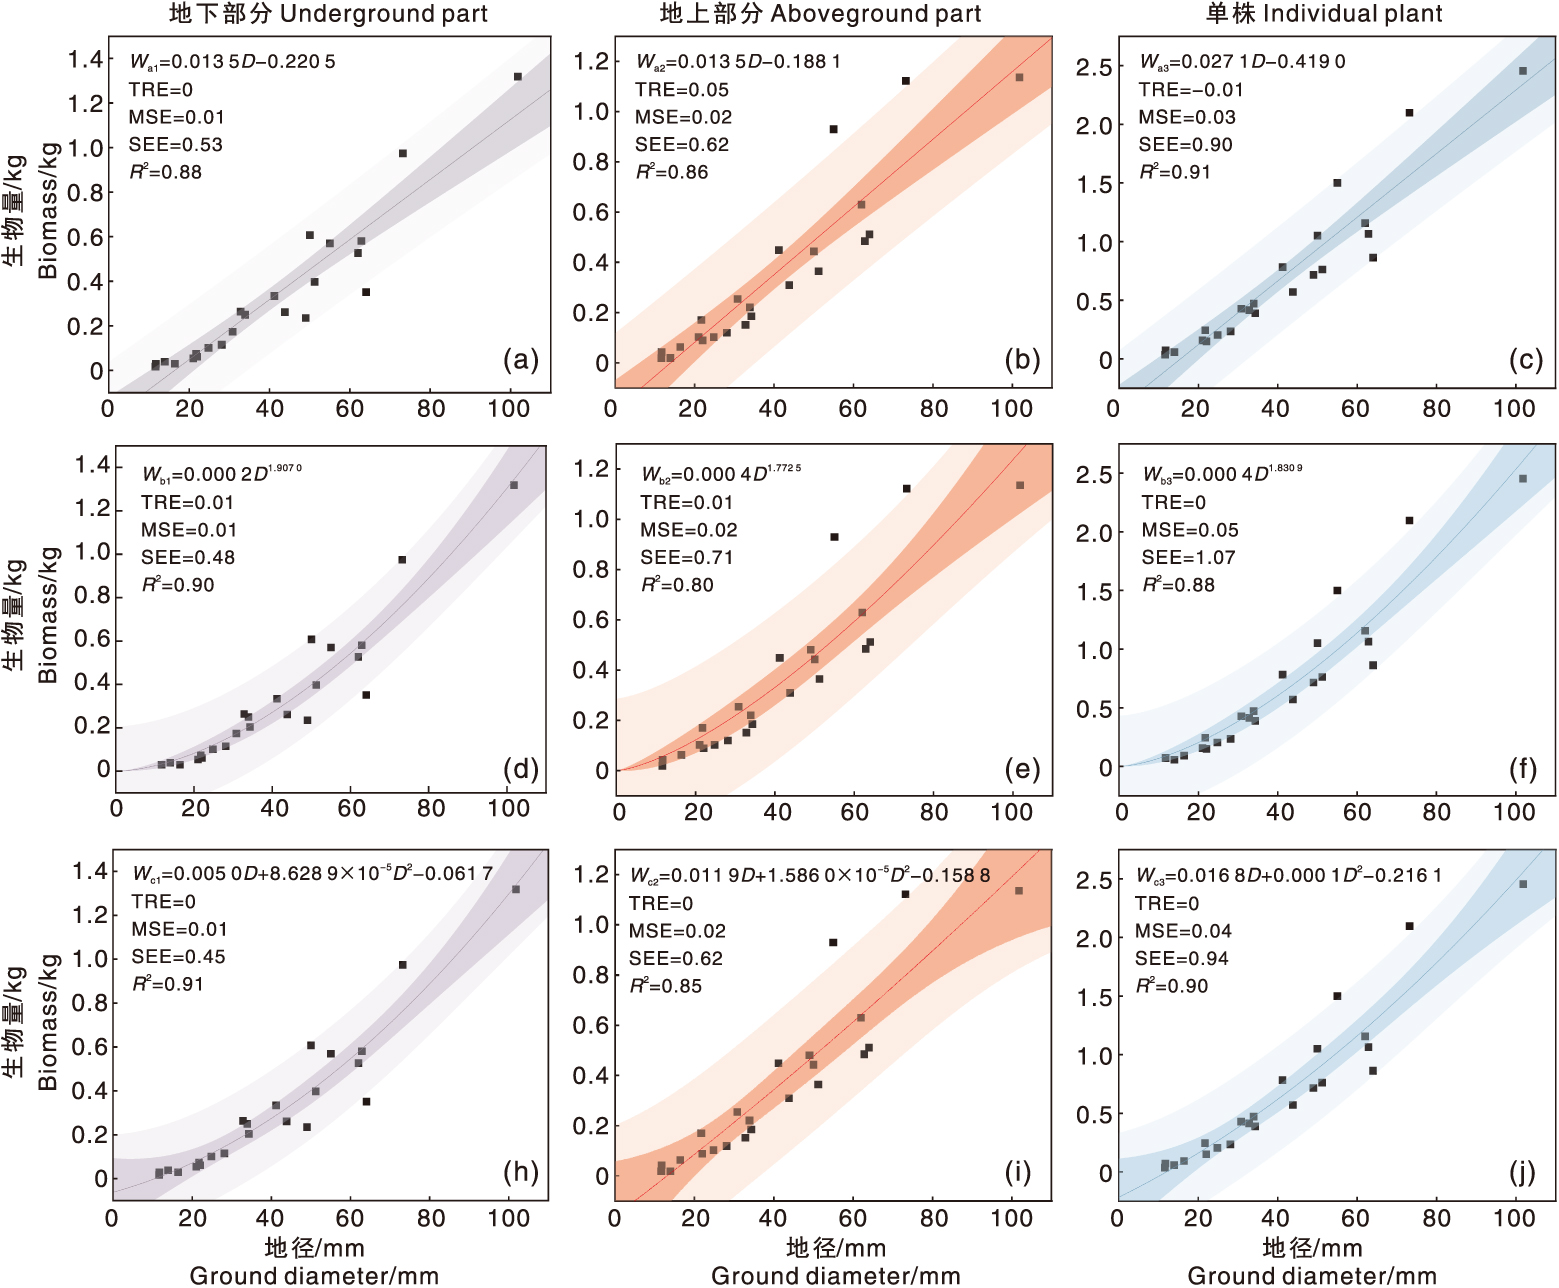
图4 茶树地径-生物量模型拟合曲线 图a、b和c为线性函数模型;图d、e和f为幂函数模型;图h、i和j为多项式函数模型。
Fig.4 Fitting curves of ground diameter-biomass models for tea plants Figure a, b and c are linear function model; Figure d, e and f are power function model; Figure h, i and j are polynomial function model.
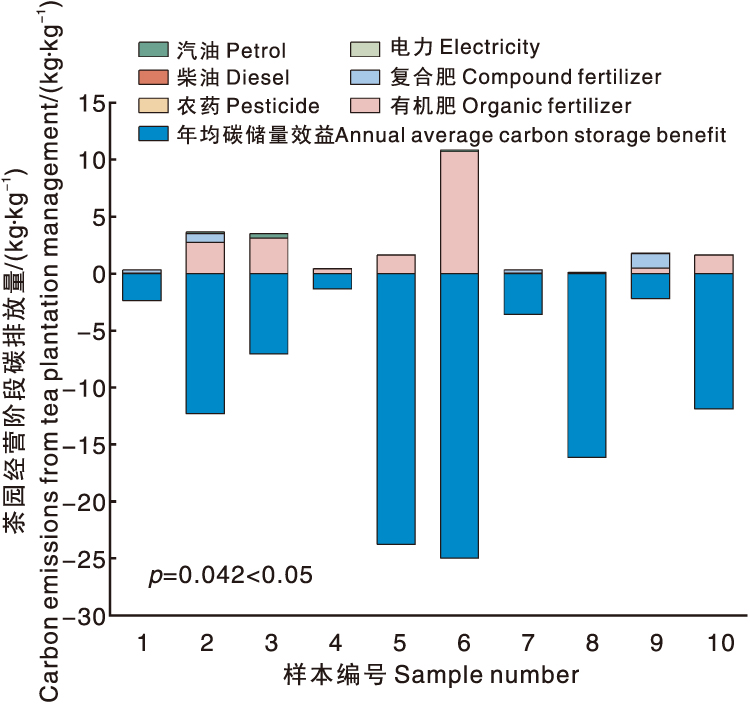
图5 茶园经营阶段碳排放量 1~6为绿茶,7~10为红茶。图6同。
Fig.5 Carbon emissions during the tea garden management phase 1-6 are green teas, 7-10 are black teas. The same as Table 6.
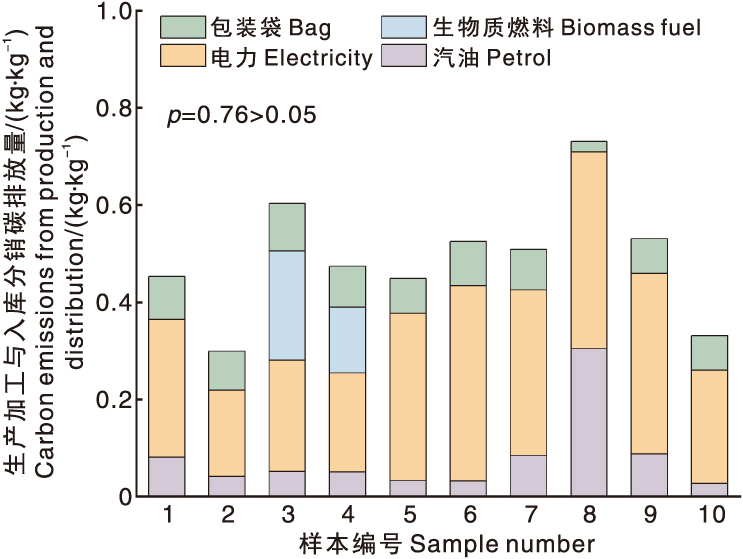
图6 生产与分销阶段的碳排放量
Fig.6 Carbon emissions during production and distribution phases
| 样本编号 Sample number | TPMP | PPS | PDS | CFP(CTPCS) | CFP(NCTPCS) |
|---|---|---|---|---|---|
| 1 | 0.34 | 0.28 | 0.17 | 0.45 | 0.79 |
| 2 | 3.64 | 0.18 | 0.12 | 0.30 | 3.94 |
| 3 | 3.52 | 0.47 | 0.13 | 0.60 | 4.12 |
| 4 | 0.44 | 0.34 | 0.13 | 0.47 | 0.92 |
| 5 | 1.65 | 0.34 | 0.10 | 0.44 | 2.10 |
| 6 | 10.84 | 0.40 | 0.12 | 0.52 | 11.36 |
| 平均Average | 3.40 | 0.34 | 0.13 | 0.46 | 3.87 |
| 7 | 0.34 | 0.34 | 0.17 | 0.51 | 0.85 |
| 8 | 0.11 | 0.42 | 0.31 | 0.73 | 0.84 |
| 9 | 1.81 | 0.37 | 0.16 | 0.53 | 2.34 |
| 10 | 1.65 | 0.23 | 0.10 | 0.33 | 1.98 |
| 平均Average | 0.98 | 0.34 | 0.19 | 0.53 | 1.50 |
表2 茶叶产品碳足迹核算结果
Table 2 The calculation results of carbon footprint of tea products
| 样本编号 Sample number | TPMP | PPS | PDS | CFP(CTPCS) | CFP(NCTPCS) |
|---|---|---|---|---|---|
| 1 | 0.34 | 0.28 | 0.17 | 0.45 | 0.79 |
| 2 | 3.64 | 0.18 | 0.12 | 0.30 | 3.94 |
| 3 | 3.52 | 0.47 | 0.13 | 0.60 | 4.12 |
| 4 | 0.44 | 0.34 | 0.13 | 0.47 | 0.92 |
| 5 | 1.65 | 0.34 | 0.10 | 0.44 | 2.10 |
| 6 | 10.84 | 0.40 | 0.12 | 0.52 | 11.36 |
| 平均Average | 3.40 | 0.34 | 0.13 | 0.46 | 3.87 |
| 7 | 0.34 | 0.34 | 0.17 | 0.51 | 0.85 |
| 8 | 0.11 | 0.42 | 0.31 | 0.73 | 0.84 |
| 9 | 1.81 | 0.37 | 0.16 | 0.53 | 2.34 |
| 10 | 1.65 | 0.23 | 0.10 | 0.33 | 1.98 |
| 平均Average | 0.98 | 0.34 | 0.19 | 0.53 | 1.50 |
| 年份 Year | 莲都 Liandu | 青田 Qingtian | 缙云 Jinyun | 遂昌 Suichang | 松阳 Songyang | 云和 Yunhe | 庆元 Qingyuan | 景宁 Jingning | 平均 Average |
|---|---|---|---|---|---|---|---|---|---|
| 2015 | 5 075 | 546 | 6 339 | 27 766 | 33 072 | 2 546 | 1 515 | 7 014 | 10 483 |
| 2016 | 5 367 | 569 | 6 351 | 29 057 | 34 786 | 2 648 | 1 521 | 6 497 | 10 848 |
| 2017 | 5 653 | 736 | 6 506 | 32 012 | 36 319 | 3 314 | 1 565 | 7 119 | 11 651 |
| 2018 | 5 481 | 896 | 6 716 | 34 436 | 38 018 | 3 492 | 1 551 | 6 363 | 12 118 |
| 2019 | 5 279 | 1 013 | 6 865 | 35 817 | 38 033 | 3 475 | 1 618 | 6 085 | 12 273 |
| 2020 | 5 306 | 1 025 | 7 341 | 37 177 | 38 859 | 3 519 | 1 679 | 6 351 | 12 655 |
| 2021 | 6 401 | 926 | 7 846 | 41 788 | 41 344 | 3 513 | 1 659 | 6 529 | 13 750 |
| 2022 | 7 008 | 911 | 8 375 | 46 335 | 43 453 | 3 565 | 1 837 | 6 877 | 14 793 |
| 2023 | 7 405 | 899 | 8 588 | 50 531 | 45 824 | 3 758 | 1 924 | 7 592 | 15 815 |
| 平均Average | 5 884 | 835 | 7 212 | 37 212 | 38 856 | 3 314 | 1 650 | 6 713 | 12 711 |
表3 丽水市茶叶产品碳排放量(不考虑碳汇)
Table 3 Carbon emissions of tea products in Lishui City (excluding carbon sequestration)
| 年份 Year | 莲都 Liandu | 青田 Qingtian | 缙云 Jinyun | 遂昌 Suichang | 松阳 Songyang | 云和 Yunhe | 庆元 Qingyuan | 景宁 Jingning | 平均 Average |
|---|---|---|---|---|---|---|---|---|---|
| 2015 | 5 075 | 546 | 6 339 | 27 766 | 33 072 | 2 546 | 1 515 | 7 014 | 10 483 |
| 2016 | 5 367 | 569 | 6 351 | 29 057 | 34 786 | 2 648 | 1 521 | 6 497 | 10 848 |
| 2017 | 5 653 | 736 | 6 506 | 32 012 | 36 319 | 3 314 | 1 565 | 7 119 | 11 651 |
| 2018 | 5 481 | 896 | 6 716 | 34 436 | 38 018 | 3 492 | 1 551 | 6 363 | 12 118 |
| 2019 | 5 279 | 1 013 | 6 865 | 35 817 | 38 033 | 3 475 | 1 618 | 6 085 | 12 273 |
| 2020 | 5 306 | 1 025 | 7 341 | 37 177 | 38 859 | 3 519 | 1 679 | 6 351 | 12 655 |
| 2021 | 6 401 | 926 | 7 846 | 41 788 | 41 344 | 3 513 | 1 659 | 6 529 | 13 750 |
| 2022 | 7 008 | 911 | 8 375 | 46 335 | 43 453 | 3 565 | 1 837 | 6 877 | 14 793 |
| 2023 | 7 405 | 899 | 8 588 | 50 531 | 45 824 | 3 758 | 1 924 | 7 592 | 15 815 |
| 平均Average | 5 884 | 835 | 7 212 | 37 212 | 38 856 | 3 314 | 1 650 | 6 713 | 12 711 |
| 年份 Year | 莲都 Liandu | 青田 Qingtian | 缙云 Jinyun | 遂昌 Suichang | 松阳 Songyang | 云和 Yunhe | 庆元 Qingyuan | 景宁 Jingning | 平均 Average |
|---|---|---|---|---|---|---|---|---|---|
| 2015 | 852 | 92 | 1 064 | 4 659 | 5 550 | 427 | 254 | 1 177 | 1 759 |
| 2016 | 901 | 96 | 1 066 | 4 876 | 5 837 | 444 | 255 | 1 090 | 1 820 |
| 2017 | 949 | 123 | 1 092 | 5 372 | 6 095 | 556 | 263 | 1 195 | 1 955 |
| 2018 | 920 | 150 | 1 127 | 5 779 | 6 380 | 586 | 260 | 1 068 | 2 034 |
| 2019 | 886 | 170 | 1 152 | 6 010 | 6 382 | 583 | 271 | 1 021 | 2 059 |
| 2020 | 890 | 172 | 1 232 | 6 239 | 6 521 | 590 | 282 | 1 066 | 2 124 |
| 2021 | 1 074 | 155 | 1 317 | 7 012 | 6 938 | 589 | 278 | 1 096 | 2 307 |
| 2022 | 1 176 | 153 | 1 405 | 7 775 | 7 292 | 598 | 308 | 1 154 | 2 482 |
| 2023 | 1 243 | 151 | 1 441 | 8 479 | 7 690 | 631 | 323 | 1 274 | 2 654 |
| 平均Average | 987 | 140 | 1 210 | 6 245 | 6 520 | 556 | 277 | 1 127 | 2 133 |
表4 丽水市茶叶产品碳排放量(含碳汇)
Table 4 Carbon emissions of tea products in Lishui City (accounting for carbon sequestration)
| 年份 Year | 莲都 Liandu | 青田 Qingtian | 缙云 Jinyun | 遂昌 Suichang | 松阳 Songyang | 云和 Yunhe | 庆元 Qingyuan | 景宁 Jingning | 平均 Average |
|---|---|---|---|---|---|---|---|---|---|
| 2015 | 852 | 92 | 1 064 | 4 659 | 5 550 | 427 | 254 | 1 177 | 1 759 |
| 2016 | 901 | 96 | 1 066 | 4 876 | 5 837 | 444 | 255 | 1 090 | 1 820 |
| 2017 | 949 | 123 | 1 092 | 5 372 | 6 095 | 556 | 263 | 1 195 | 1 955 |
| 2018 | 920 | 150 | 1 127 | 5 779 | 6 380 | 586 | 260 | 1 068 | 2 034 |
| 2019 | 886 | 170 | 1 152 | 6 010 | 6 382 | 583 | 271 | 1 021 | 2 059 |
| 2020 | 890 | 172 | 1 232 | 6 239 | 6 521 | 590 | 282 | 1 066 | 2 124 |
| 2021 | 1 074 | 155 | 1 317 | 7 012 | 6 938 | 589 | 278 | 1 096 | 2 307 |
| 2022 | 1 176 | 153 | 1 405 | 7 775 | 7 292 | 598 | 308 | 1 154 | 2 482 |
| 2023 | 1 243 | 151 | 1 441 | 8 479 | 7 690 | 631 | 323 | 1 274 | 2 654 |
| 平均Average | 987 | 140 | 1 210 | 6 245 | 6 520 | 556 | 277 | 1 127 | 2 133 |
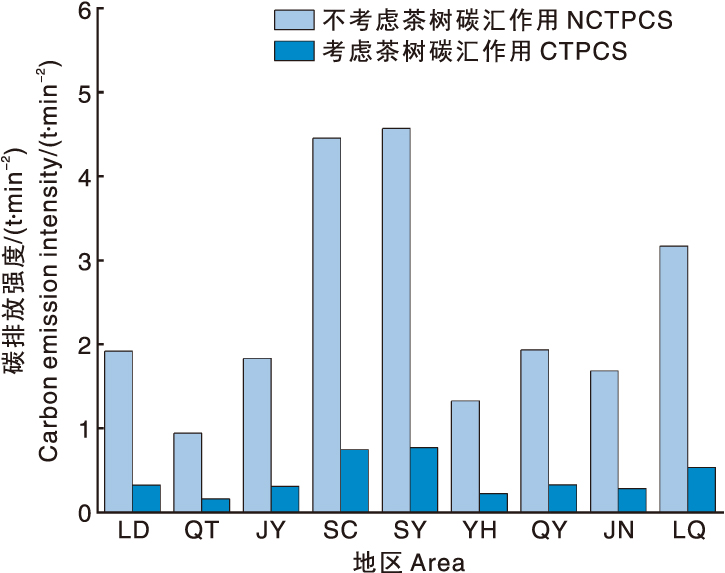
图7 丽水市茶叶产品碳排放强度 LD、QT、JY、SC、SY、YH、QY、JN、LQ分别代表莲都、青田、缙云、遂昌、松阳、云和、庆元、景宁、龙泉;NCTPCS与CTPCS分别表示不考虑茶树碳汇作用和考虑茶树碳汇作用。
Fig.7 Carbon emission intensity of tea products in Lishui City LD, QT, JY, SC, SY, YH, QY, JN and LQ represent Liandu, Qingtian, Jinyun, Suichang, Songyang, Yunhe, Qingyuan, Jingning, and Longquan, respectively. NCTPCS and CTPCS refer to the scenarios of not considering and considering the carbon sequestration role of tea trees, respectively.
| [1] | CHETTRI V, GHOSH C. Tea gardens, a potential carbon-sink for climate change mitigation[J]. Current Agriculture Research Journal, 2024, 11(3): 695-704. |
| [2] | 沈星荣, 汪秋红, 吴洵, 等. 充分发挥茶园碳汇功能, 促进茶叶低碳生产发展[J]. 中国农学通报, 2012, 28(8): 254-260. |
| SHEN X R, WANG Q H, WU X, et al. Increasing tea garden carbon sink capacity, promoting the development of low carbon tea production[J]. Chinese Agricultural Science Bulletin, 2012, 28(8): 254-260. | |
| [3] | 宋同清, 王克林, 彭晚霞, 等. 亚热带丘陵茶园间作白三叶草的生态效应[J]. 生态学报, 2006, 26(11): 3647-3655. |
| SONG T Q, WANG K L, PENG W X, et al. Ecological effects of intercropping white clover on tea plantation in a subtropical hilly region[J]. Acta Ecologica Sinica, 2006, 26(11): 3647-3655. | |
| [4] | 中国茶叶流通协会. 2022年中国茶叶生产与内销形势分析[R]. 北京: 中国茶叶流通协会, 2022. |
| [5] | 袁俐雯, 张俊飚, 秦江楠. 我国茶业碳汇的时空演变规律和空间分异格局研究[J]. 茶叶科学, 2024, 44(1): 149-160. |
| YUAN L W, ZHANG J B, QIN J N. Study on the spatiotemporal evolution and spatial differentiation pattern of carbon sink in China’s tea industry[J]. Journal of Tea Science, 2024, 44(1): 149-160. | |
| [6] | DING F, HU Y, LIU Y, et al. Greenhouse gas footprint and reduction potential in a typical Chinese tea-producing area[J]. Earth Critical Zone, 2024, 1(1): 100017. |
| [7] | XU Q, HU K L, WANG X L, et al. Carbon footprint and primary energy demand of organic tea in China using a life cycle assessment approach[J]. Journal of Cleaner Production, 2019, 233: 782-792. |
| [8] | AZAPAGIC A, BORE J, CHESEREK B, et al. The global warming potential of production and consumption of Kenyan tea[J]. Journal of Cleaner Production, 2016, 112: 4031-4040. |
| [9] | LI S Y, WU X, XUE H, et al. Quantifying carbon storage for tea plantations in China[J]. Agriculture, Ecosystems & Environment, 2011, 141(3/4): 390-398. |
| [10] | 张敏, 陈永根, 于翠平, 等. 在茶园生产周期过程中茶树群落生物量和碳储量动态估算[J]. 浙江大学学报(农业与生命科学版), 2013, 39(6): 687-694. |
| ZHANG M, CHEN Y G, YU C P, et al. Dynamic assessments of plant biomass and carbon storage during the production cycle of tea gardens[J]. Journal of Zhejiang University(Agriculture and Life Sciences), 2013, 39(6): 687-694. | |
| [11] | 林生明. 杉木出材量估测方法的探讨[J]. 浙江林业科技, 1991, 11(2): 57-60. |
| LIN S M. Preliminary study on calculating method of 0utput of Chinese fir timber[J]. Journal of Zhejiang Forestry Science and Technology, 1991, 11(2): 57-60. | |
| [12] | 宇万太, 于永强. 植物地下生物量研究进展[J]. 应用生态学报, 2001, 12(6): 927-932. |
| YU W T, YU Y Q. Advances in the rescarch of underground biomass[J]. Chinese Journal of Applied Ecology, 2001, 12(6): 927-932. | |
| [13] | 格日乐图, 吴志民, 杨校生, 等. 广宁茶秆竹地上生物量分布特征研究[J]. 林业科学研究, 2011, 24(1): 127-131. |
| GERI L T, WU Z M, YANG X S, et al. Study on above-ground biomass allocation characteristics of Pseudosasa amabilis[J]. Forest Research, 2011, 24(1): 127-131. | |
| [14] | 王佳慧, 李凤日, 董利虎. 基于不同预测变量的天然椴树可加性地上生物量模型构建[J]. 应用生态学报, 2018, 29(11): 3685-3695. |
| WANG J H, LI F R, DONG L H. Additive aboveground biomass equations based on different predictors for natural Tilia Linn[J]. Chinese Journal of Applied Ecology, 2018, 29(11): 3685-3695. | |
| [15] | 邹凯, 谈丽华, 巫娟, 等. 石灰岩山地淡竹生物量模型研究[J]. 江西农业大学学报(自然科学版), 2020, 42(1): 110-117. |
| ZOU K, TAN L H, WU J, et al. A study on biomass predicting models of Phyllostachys glauca in the limestone mountains[J]. Acta Agriculturae Universitatis Jiangxiensis(Natural Sciences Edition), 2020, 42(1): 110-117. | |
| [16] | 杨雪宁, 张永强, 张选泽, 等. 基于留一交叉验证法的APSIM-Maize产量模拟[J]. 作物学报, 2023, 49(10): 2854-2860. |
| YANG X N, ZHANG Y Q, ZHANG X Z, et al. Yield simulation from APSIM-Maize by using the leave-one-out cross validation approach[J]. Acta Agronomica Sinica, 2023, 49(10): 2854-2860. | |
| [17] | 王鸣, 易武, 邓永煌. 基于自适应搜索权重的滑坡位移组合预测[J]. 水力发电, 2016, 42(2): 26-28. |
| WANG M, YI W, DENG Y H. Landslide displacement prediction by combination model based on adaptive weight searching[J]. Water Power, 2016, 42(2): 26-28. | |
| [18] | 庞榆, 贺同鑫, 孙建飞, 等. 北热带喀斯特森林优势树种细根生物量估算模型构建[J]. 植物生态学报, 2024, 48(10): 1312-1325. |
| PANG Y, HE T X, SUN J F, et al. Construction of fine root biomass estimation models of dominant tree species in a north tropic karst forest[J]. Chinese Journal of Plant Ecology, 2024, 48(10): 1312-1325. | |
| [19] | 孙凯, 梁龙, 余豪. 贵州省雷山县茶叶生产碳排放评价及减排潜力分析[J]. 中国茶叶, 2023, 45(4): 48-53. |
| SUN K, LIANG L, YU H. Carbon emission evaluation and reduction potential analysis of tea production in Leishan County, Guizhou Province[J]. China Tea, 2023, 45(4): 48-53. | |
| [20] | GU L, ZHOU Y F, MEI T T, et al. Carbon footprint analysis of bamboo scrimber flooring: implications for carbon sequestration of bamboo forests and its products[J]. Forests, 2019, 10(1): 51. |
| [21] | ZHANG M, CHEN Y G, FAN D M, et al. Temporal evolution of carbon storage in Chinese tea plantations from 1950 to 2010[J]. Pedosphere, 2017, 27(1): 121-128. |
| [22] | PANG J P, LI H P, TANG X G, et al. Carbon dynamics and environmental controls of a hilly tea plantation in Southeast China[J]. Ecology and Evolution, 2019, 9(17): 9723-9735. |
| [23] | LIANG L, RIDOUTT B G, WANG L Y, et al. China’s tea industry: net greenhouse gas emissions and mitigation potential[J]. Agriculture, 2021, 11(4): 363. |
| [24] | RIGARLSFORD G, DE SILVA J, TUWEI G, et al. Potential management interventions to mitigate greenhouse gas emissions from tea cultivation[J]. Carbon Management, 2020, 11(6): 631-643. |
| [25] | TAULO J L, SEBITOSI A B. Material and energy flow analysis of the Malawian tea industry[J]. Renewable and Sustainable Energy Reviews, 2016, 56: 1337-1350. |
| [26] | CHEN X H, MA C C, ZHOU H M, et al. Identifying the main crops and key factors determining the carbon footprint of crop production in China, 2001-2018[J]. Resources, Conservation and Recycling, 2021, 172: 105661. |
| [1] | 祁慧博, 季鹏, 郑巧儿, 赵婧, 龙飞. 中国农村居民食物消费碳足迹的时空格局与驱动因素[J]. 浙江农业学报, 2025, 37(9): 1991-2002. |
| [2] | 崔宁波, 肖扬, 杨佳利, 王婷. 东北黑土区耕地生态承载力时空分异与可持续性分析[J]. 浙江农业学报, 2025, 37(4): 954-964. |
| [3] | 张惠云, 秦丽杰, 贾利. 吉林省水稻生产的碳足迹与水足迹时空变化特征[J]. 浙江农业学报, 2021, 33(6): 974-983. |
| [4] | 张青青, 梁晶, 伍海兵, 郑思俊, 黄军华. 城市化进程中土地利用方式改变对土壤有机碳库的影响——以上海三林楔形绿地为例[J]. 浙江农业学报, 2021, 33(6): 1062-1068. |
| [5] | 廖小锋,赵晓朋,谢元贵*. 贵州喀斯特地区五种植被恢复模式碳储量异质性研究[J]. 浙江农业学报, 2015, 27(12): 2100-. |
| [6] | 安玲玲;吕晓男;麻万诸;*;任周桥;邓勋飞;陈晓佳. 浙江省土壤有机碳密度与储量的初步研究[J]. , 2014, 26(1): 0-153. |
| 阅读次数 | ||||||
|
全文 |
|
|||||
|
摘要 |
|
|||||
