浙江农业学报 ›› 2026, Vol. 38 ›› Issue (2): 248-257.DOI: 10.3969/j.issn.1004-1524.20250508
南瓜果实品质评价的指标筛选与模型构建
刘静1( ), 王尖2, 黄钰1, 吴晓花2, 郭轩赫1, 汪颖2, 李国景2, 许小江1,*()
1.绍兴市农业科学研究院 浙江 绍兴 312003 2.浙江省农业科学院 蔬菜研究所 浙江 杭州 310021
-
收稿日期:2025-07-25出版日期:2026-02-25发布日期:2026-03-24 -
作者简介:刘静,研究方向为葫芦科蔬菜育种。E-mail:172547603@qq.com -
通讯作者:*许小江,E-mail:13858539612@163.com -
基金资助:浙江省农业科学院院地合作项目(ZJTY2024-A-58);绍兴市科技计划项目(2023A12001);浙江省农业(蔬菜)新品种选育重大科技专项(2021C02065-2-3)
Indicator screening and model development for evaluating pumpkin fruit quality
LIU Jing1(), WANG Jian2, HUANG Yu1, WU Xiaohua2, GUO Xuanhe1, WANG Ying2, LI Guojing2, XU Xiaojiang1,*()
1. Shaoxing Academy of Agricultural Sciences Shaoxing 312003, Zhejiang, China 2. Institute of Vegetables ,Zhejiang Academy of Agricultural Sciences Hangzhou 310021, China
-
Received:2025-07-25Published:2026-02-25Online:2026-03-24
摘要:
为构建南瓜果实品质综合评价模型,本研究以51份中国南瓜(Cucurbita moschata)和95份印度南瓜(Cucurbita maxima)为材料,测定其11项果实品质指标,综合运用相关分析、因子分析与聚类分析方法,结合公因子二维分布图,建立南瓜果实品质评价模型。结果表明,中国南瓜的含水量、纤维素含量、可溶性糖含量、β-胡萝卜素含量和甜度均显著高于印度南瓜;印度南瓜的淀粉含量、直链淀粉含量、黏度、干湿度和纤维感均极显著高于中国南瓜。11项品质指标的变异系数范围为9.00%~69.04%,其中含水量变异系数最小,可溶性糖含量变异系数最大。通过因子分析提取出5个公因子,累计方差贡献率为90.27%;第一公因子(F1)的方差贡献率最高(34.60%),主要关联含水量、可溶性糖含量、淀粉含量和直链淀粉含量。基于此构建南瓜果实品质评价模型:Y=0.383 2F1+0.263 2F2+0.132 1F3+0.127 5F4+0.094 0F5。通过相关分析与聚类分析,进一步将11项品质指标简化为淀粉含量、纤维感和可溶性糖含量3个代表性指标。F1与第二公因子(F2)的散点图显示,模型预测值与实际测定值高度一致。本研究建立的评价模型可为南瓜果实品质评价提供方法依据,对高品质南瓜品种选育具有参考价值。
中图分类号:
引用本文
刘静, 王尖, 黄钰, 吴晓花, 郭轩赫, 汪颖, 李国景, 许小江. 南瓜果实品质评价的指标筛选与模型构建[J]. 浙江农业学报, 2026, 38(2): 248-257.
LIU Jing, WANG Jian, HUANG Yu, WU Xiaohua, GUO Xuanhe, WANG Ying, LI Guojing, XU Xiaojiang. Indicator screening and model development for evaluating pumpkin fruit quality[J]. Acta Agriculturae Zhejiangensis, 2026, 38(2): 248-257.
| 感官指标 Sensory indicator | 评分范围Score range | ||
|---|---|---|---|
| 0~2 | 3~5 | 6~7 | |
| 柔软度Softness | 柔软Soft | 较硬Relative hard | 非常硬Very hard |
| 黏度Viscosity | 很黏Very viscous | 黏性一般Viscous | 不黏Not viscous |
| 干湿度Dryness/wetness | 口感干燥Dry taste | 口感较为潮湿Wet taste | 口感湿润潮湿Very wet taste |
| 纤维感Fibrous texture | 光滑、无纤维感Smooth, no fibrous feeling | 中度纤维感Moderate fibrous feeling | 纤维感强Strong fibrous feeling |
| 甜度Sweetness | 无甜味Not sweet | 较甜Sweet | 非常甜Very sweet |
表1 南瓜果实感官评价指标及评分标准
Table 1 Sensory evaluation indicators and scoring criteria for pumpkin fruit
| 感官指标 Sensory indicator | 评分范围Score range | ||
|---|---|---|---|
| 0~2 | 3~5 | 6~7 | |
| 柔软度Softness | 柔软Soft | 较硬Relative hard | 非常硬Very hard |
| 黏度Viscosity | 很黏Very viscous | 黏性一般Viscous | 不黏Not viscous |
| 干湿度Dryness/wetness | 口感干燥Dry taste | 口感较为潮湿Wet taste | 口感湿润潮湿Very wet taste |
| 纤维感Fibrous texture | 光滑、无纤维感Smooth, no fibrous feeling | 中度纤维感Moderate fibrous feeling | 纤维感强Strong fibrous feeling |
| 甜度Sweetness | 无甜味Not sweet | 较甜Sweet | 非常甜Very sweet |
| 栽培种 Cultivar | 含水量/% Moisture content/% | 纤维素含量/ (mg·g-1) Cellulose content/ (mg·g-1) | 可溶性糖含量/ (mg·g-1) Soluble sugar content/ (mg·g-1) | 淀粉含量/ (mg·g-1) Starch content/ (mg·g-1) | 直链淀粉含量/ (mg·g-1) Amylose content/ (mg·g-1) | β-胡萝卜素含量/ (μg·g-1) β-Carotene content/ (μg·g-1) | 柔软度 Softness | 黏度 Viscosity | 干湿度 Dryness/ wetness | 纤维感 Fibrous texture | 甜度 Sweetness |
|---|---|---|---|---|---|---|---|---|---|---|---|
| 印度南瓜 | 79.43 | 3.41 | 9.83 | 57.66 | 11.62 | 27.10 | 5.00 | 4.35 | 4.81 | 4.91 | 3.32 |
| Cucurbita maxima | |||||||||||
| 中国南瓜 | 89.54*** | 5.03*** | 26.57*** | 22.84*** | 5.86*** | 43.49*** | 5.13ns | 3.41** | 3.65*** | 3.47*** | 3.79* |
| Cucurbita moschata |
表2 印度南瓜与中国南瓜的品质指标差异
Table 2 Differences in quality indicators between Cucurbita maxima and Cucurbita moschata
| 栽培种 Cultivar | 含水量/% Moisture content/% | 纤维素含量/ (mg·g-1) Cellulose content/ (mg·g-1) | 可溶性糖含量/ (mg·g-1) Soluble sugar content/ (mg·g-1) | 淀粉含量/ (mg·g-1) Starch content/ (mg·g-1) | 直链淀粉含量/ (mg·g-1) Amylose content/ (mg·g-1) | β-胡萝卜素含量/ (μg·g-1) β-Carotene content/ (μg·g-1) | 柔软度 Softness | 黏度 Viscosity | 干湿度 Dryness/ wetness | 纤维感 Fibrous texture | 甜度 Sweetness |
|---|---|---|---|---|---|---|---|---|---|---|---|
| 印度南瓜 | 79.43 | 3.41 | 9.83 | 57.66 | 11.62 | 27.10 | 5.00 | 4.35 | 4.81 | 4.91 | 3.32 |
| Cucurbita maxima | |||||||||||
| 中国南瓜 | 89.54*** | 5.03*** | 26.57*** | 22.84*** | 5.86*** | 43.49*** | 5.13ns | 3.41** | 3.65*** | 3.47*** | 3.79* |
| Cucurbita moschata |
| 指标 Quality indicators | 平均值 Average | 最大值 Maximum | 最小值 Minimum | 标准差 Standard deviation | 变异系数 Coefficient of variation/% |
|---|---|---|---|---|---|
| 含水量/%Moisture content/% | 82.92 | 97.54 | 68.53 | 7.46 | 9.00 |
| 纤维素含量/(mg·g-1)Cellulose content/(mg·g-1) | 3.97 | 14.12 | 1.72 | 1.81 | 45.59 |
| 可溶性糖含量/(mg·g-1)Soluble sugar content/(mg·g-1) | 15.60 | 43.12 | 1.83 | 10.77 | 69.04 |
| 淀粉含量/(mg·g-1)Starch content/(mg·g-1) | 45.65 | 84.00 | 3.23 | 23.96 | 52.49 |
| 直链淀粉含量/(mg·g-1)Amylose content/(mg·g-1) | 9.64 | 22.03 | 0.77 | 5.22 | 54.18 |
| β-胡萝卜素含量/(μg·g-1) β-Carotene content/(μg·g-1) | 32.75 | 64.98 | 13.97 | 12.61 | 38.49 |
| 柔软度Softness | 5.34 | 6.80 | 2.80 | 0.95 | 17.80 |
| 黏度Viscosity | 4.04 | 7.00 | 0.60 | 1.48 | 36.64 |
| 干湿度Dryness/wetness | 4.01 | 7.20 | 0.70 | 1.43 | 35.66 |
| 纤维感Fibrous texture | 4.53 | 7.06 | 1.20 | 1.34 | 29.59 |
| 甜度Sweetness | 3.41 | 6.40 | 0.08 | 1.33 | 38.84 |
表3 南瓜果实品质指标的统计分析
Table 3 Statistical analysis of pumpkin fruit quality indicators
| 指标 Quality indicators | 平均值 Average | 最大值 Maximum | 最小值 Minimum | 标准差 Standard deviation | 变异系数 Coefficient of variation/% |
|---|---|---|---|---|---|
| 含水量/%Moisture content/% | 82.92 | 97.54 | 68.53 | 7.46 | 9.00 |
| 纤维素含量/(mg·g-1)Cellulose content/(mg·g-1) | 3.97 | 14.12 | 1.72 | 1.81 | 45.59 |
| 可溶性糖含量/(mg·g-1)Soluble sugar content/(mg·g-1) | 15.60 | 43.12 | 1.83 | 10.77 | 69.04 |
| 淀粉含量/(mg·g-1)Starch content/(mg·g-1) | 45.65 | 84.00 | 3.23 | 23.96 | 52.49 |
| 直链淀粉含量/(mg·g-1)Amylose content/(mg·g-1) | 9.64 | 22.03 | 0.77 | 5.22 | 54.18 |
| β-胡萝卜素含量/(μg·g-1) β-Carotene content/(μg·g-1) | 32.75 | 64.98 | 13.97 | 12.61 | 38.49 |
| 柔软度Softness | 5.34 | 6.80 | 2.80 | 0.95 | 17.80 |
| 黏度Viscosity | 4.04 | 7.00 | 0.60 | 1.48 | 36.64 |
| 干湿度Dryness/wetness | 4.01 | 7.20 | 0.70 | 1.43 | 35.66 |
| 纤维感Fibrous texture | 4.53 | 7.06 | 1.20 | 1.34 | 29.59 |
| 甜度Sweetness | 3.41 | 6.40 | 0.08 | 1.33 | 38.84 |
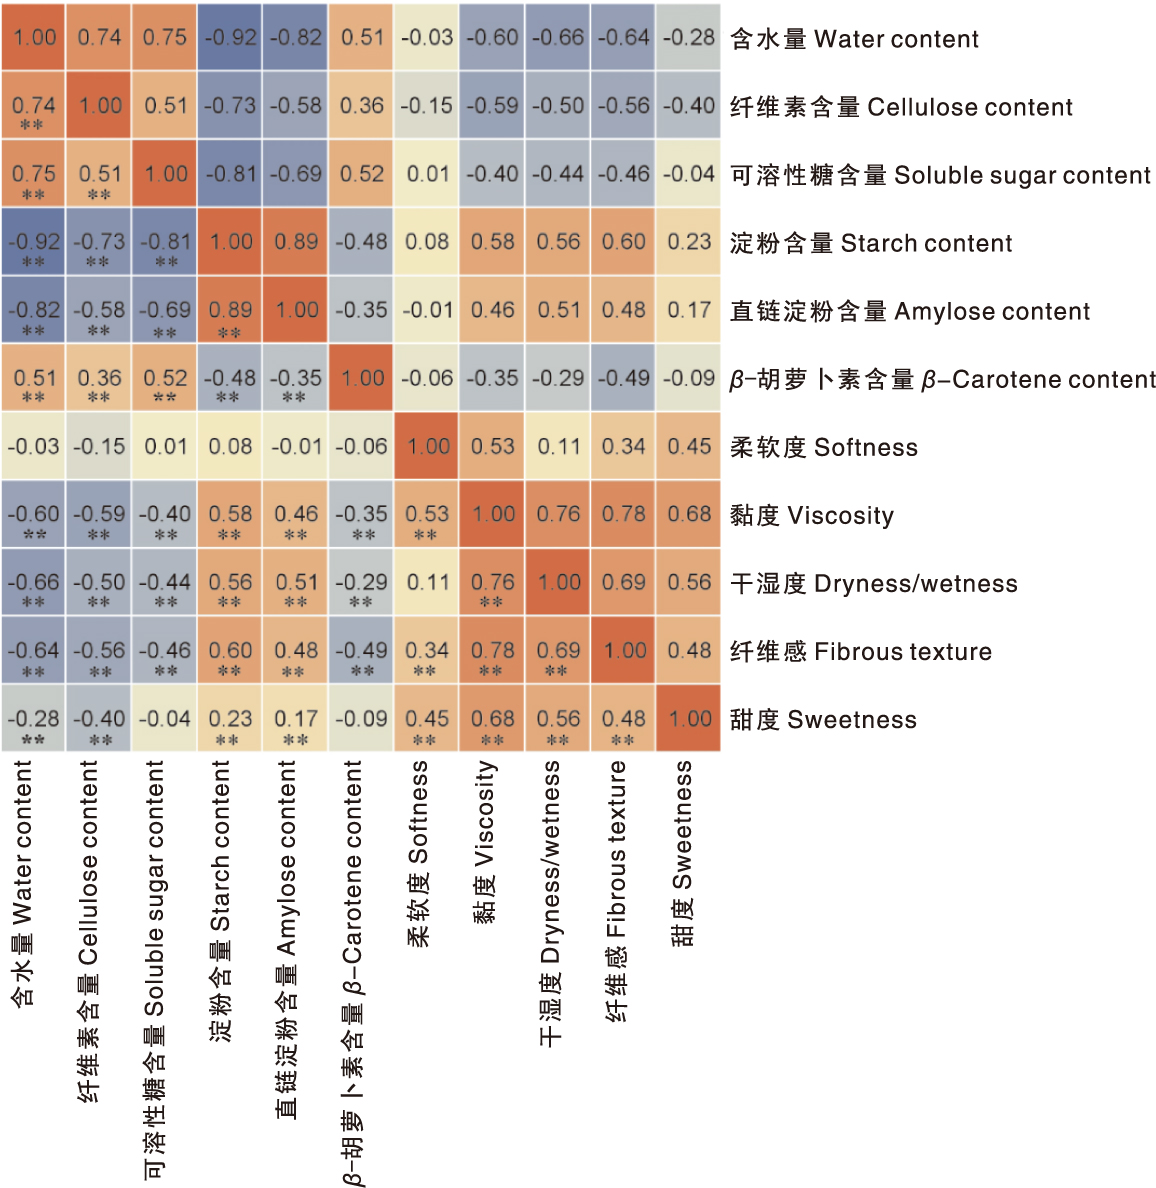
图1 南瓜品质指标的相关性 红色表示2品质指标呈正相关,颜色越深、数值越大则正相关性越强;蓝色表示2品质指标呈负相关,颜色越深、数值越小则负相关性越强。
Fig.1 Correlation among pumpkin quality traits Red indicates a positive correlation between two quality indicators, where a darker color and larger value signify a stronger positive correlation; blue indicates a negative correlation between two quality indicators, where a darker color and smaller value signify a stronger negative correlation.
| 指标Indicators | F1 | F2 | F3 | F4 | F5 |
|---|---|---|---|---|---|
| 含水量Moisture content | -0.808 6 | -0.333 9 | 0.238 9 | 0.048 7 | 0.302 2 |
| 纤维素含量Cellulose content | -0.488 6 | -0.297 4 | 0.158 3 | -0.063 8 | 0.769 6 |
| 可溶性糖含量Soluble sugar content | -0.850 3 | -0.088 4 | 0.319 6 | -0.049 4 | -0.034 3 |
| 淀粉含量Starch content | 0.886 7 | 0.230 5 | -0.198 9 | 0.067 5 | -0.270 9 |
| 直链淀粉含量Amylose content | 0.889 8 | 0.203 6 | -0.023 1 | -0.019 1 | -0.166 6 |
| β-胡萝卜素含量β-Carotene content | -0.266 1 | -0.100 4 | 0.931 2 | -0.012 7 | 0.100 4 |
| 柔软度Softness | -0.019 5 | 0.211 8 | -0.019 8 | 0.964 6 | -0.030 9 |
| 黏度Viscosity | 0.389 0 | 0.724 7 | -0.188 4 | 0.407 8 | -0.166 5 |
| 干湿度Dryness/wetness | 0.454 6 | 0.837 2 | -0.103 7 | -0.097 8 | 0.006 1 |
| 纤维感Fibrous texture | 0.427 1 | 0.616 3 | -0.414 7 | 0.236 6 | -0.092 6 |
| 甜度Sweetness | -0.049 9 | 0.805 3 | 0.046 5 | 0.298 5 | -0.315 6 |
表4 南瓜果实品质指标旋转后的因子载荷
Table 4 Rotated factor loading values of pumpkin fruit quality indicators
| 指标Indicators | F1 | F2 | F3 | F4 | F5 |
|---|---|---|---|---|---|
| 含水量Moisture content | -0.808 6 | -0.333 9 | 0.238 9 | 0.048 7 | 0.302 2 |
| 纤维素含量Cellulose content | -0.488 6 | -0.297 4 | 0.158 3 | -0.063 8 | 0.769 6 |
| 可溶性糖含量Soluble sugar content | -0.850 3 | -0.088 4 | 0.319 6 | -0.049 4 | -0.034 3 |
| 淀粉含量Starch content | 0.886 7 | 0.230 5 | -0.198 9 | 0.067 5 | -0.270 9 |
| 直链淀粉含量Amylose content | 0.889 8 | 0.203 6 | -0.023 1 | -0.019 1 | -0.166 6 |
| β-胡萝卜素含量β-Carotene content | -0.266 1 | -0.100 4 | 0.931 2 | -0.012 7 | 0.100 4 |
| 柔软度Softness | -0.019 5 | 0.211 8 | -0.019 8 | 0.964 6 | -0.030 9 |
| 黏度Viscosity | 0.389 0 | 0.724 7 | -0.188 4 | 0.407 8 | -0.166 5 |
| 干湿度Dryness/wetness | 0.454 6 | 0.837 2 | -0.103 7 | -0.097 8 | 0.006 1 |
| 纤维感Fibrous texture | 0.427 1 | 0.616 3 | -0.414 7 | 0.236 6 | -0.092 6 |
| 甜度Sweetness | -0.049 9 | 0.805 3 | 0.046 5 | 0.298 5 | -0.315 6 |
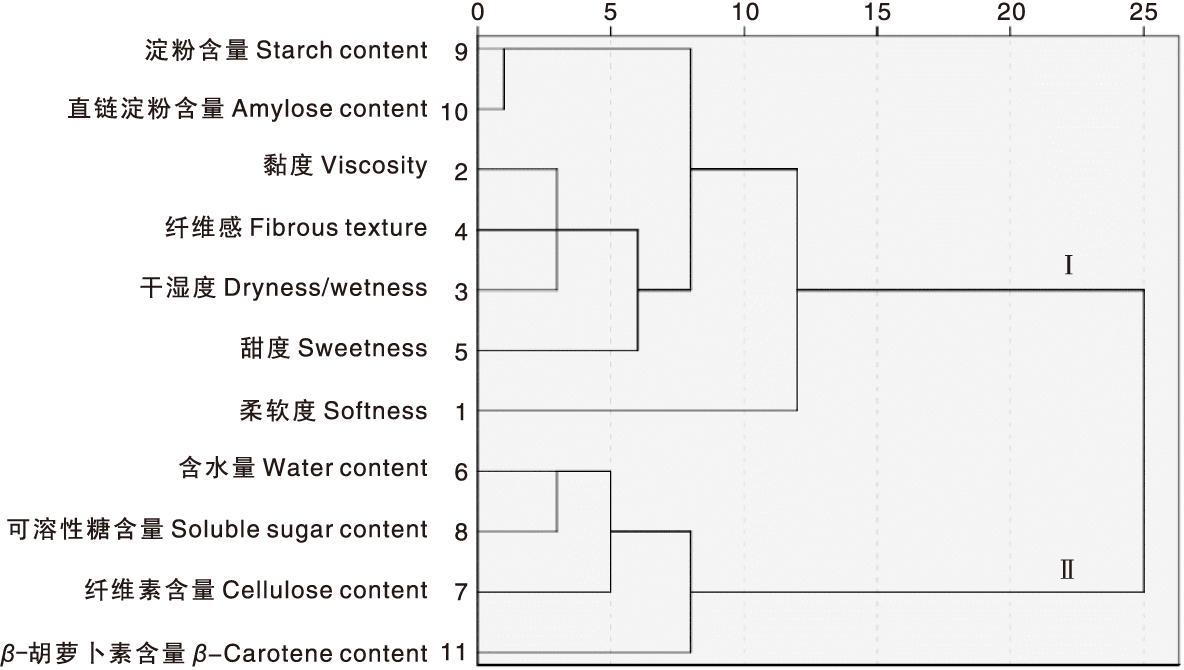
图2 南瓜品质指标的聚类分析
Fig.2 Cluster analysis of pumpkin quality traits
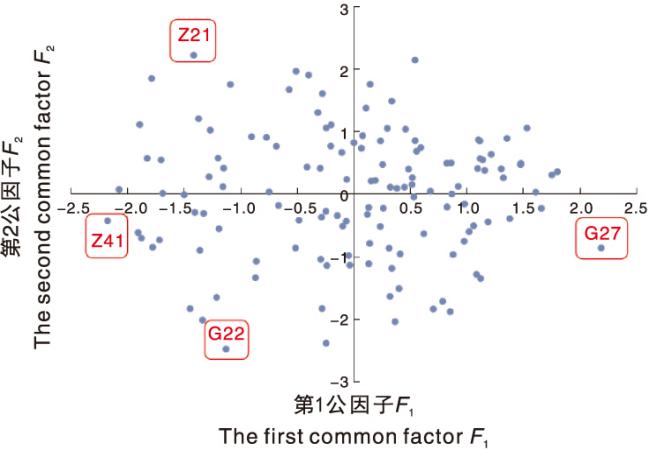
图3 146份南瓜种质资源基于第一公因子与第二公因子的散点分布
Fig.3 Scatter plot distribution of 146 pumpkin accessions based on the first common factor and the second common factor
| [1] | 黄峰华, 李晓晨, 王敏, 等. 中国南瓜产业优势及贸易竞争力分析[J]. 农业展望, 2023, 19(11): 87-94. |
| HUANG F H, LI X C, WANG M, et al. Analysis on China’s industry advantages and trade competitiveness of pumpkin[J]. Agricultural Outlook, 2023, 19(11): 87-94. | |
| [2] | 李俊星, 钟玉娟, 罗文龙, 等. 广东南瓜的品种改良及发展[J]. 中国瓜菜, 2019, 32(2): 50-52. |
| LI J X, ZHONG Y J, LUO W L, et al. Variety improvement and development of pumpkin in Guangdong[J]. China Cucurbits and Vegetables, 2019, 32(2): 50-52. | |
| [3] | 熊建华, 罗秋水, 闵嗣璠, 等. 蜜本南瓜不同部位营养成分分析与评价[J]. 湖北农业科学, 2009, 48(9): 2239-2241. |
| XIONG J H, LUO Q S, MIN S F, et al. Analysis and evaluation on the nutritional components in different parts of Miben pumpkin[J]. Hubei Agricultural Sciences, 2009, 48(9): 2239-2241. | |
| [4] | 任广乾, 杨世康, 卞世杰, 等. 基于相关性和主成分分析评价南瓜的营养品质[J]. 中国瓜菜, 2023, 36(6): 37-42. |
| REN G Q, YANG S K, BIAN S J, et al. Evaluation of pumpkin nutrient quality based on correlation and principal component analysis[J]. China Cucurbits and Vegetables, 2023, 36(6): 37-42. | |
| [5] | 杨宏, 李跃建, 王长林, 等. 南瓜口感评价与营养成分的相关性和回归分析[J]. 中国蔬菜, 2016(11): 25-32. |
| YANG H, LI Y J, WANG C L, et al. Correlation and regression analysis of pumpkin taste evaluation and nutritional components[J]. China Vegetables, 2016(11): 25-32. | |
| [6] | 闫春冬, 王云莉, 田金丽, 等. 肉用印度南瓜营养品质的简易鉴定方法[J]. 北方园艺, 2018(21): 76-80. |
| YAN C D, WANG Y L, TIAN J L, et al. A simple method for identifying nutritional quality of Indian pumpkin[J]. Northern Horticulture, 2018(21): 76-80. | |
| [7] | 鲍江峰, 夏仁学, 邓秀新, 等. 用主成分分析法选择纽荷尔脐橙品质的评价因素[J]. 华中农业大学学报, 2004, 23(6): 663-666. |
| BAO J F, XIA R X, DENG X X, et al. The quality evaluation factors selection of Newhall orange by the principal component analysis[J]. Journal of Huazhong Agricultural University, 2004, 23(6): 663-666. | |
| [8] | 张海英, 韩涛, 王有年, 等. 桃果实品质评价因子的选择[J]. 农业工程学报, 2006, 22(8): 235-239. |
| ZHANG H Y, HAN T, WANG Y N, et al. Selection of factors for evaluating peach(Prunus persica) fruit quality[J]. Transactions of the Chinese Society of Agricultural Engineering, 2006, 22(8): 235-239. | |
| [9] | 张淑文, 梁森苗, 郑锡良, 等. 杨梅优株果实品质的主成分分析及综合评价[J]. 果树学报, 2018, 35(8): 977-986. |
| ZHANG S W, LIANG S M, ZHENG X L, et al. Principal component analysis and comprehensive evaluation of fruit quality in some advanced selections of Chinese bayberry[J]. Journal of Fruit Science, 2018, 35(8): 977-986. | |
| [10] | 徐强, 刘进生, 陈学好, 等. 加工类型黄瓜品质性状的主成分及聚类分析[J]. 扬州大学学报, 2003, 24(4): 78-81. |
| XU Q, LIU J S, CHEN X H, et al. Principal component and cluster analysis of quality characters of pickling cucumber (Cucumis sativus L.)[J]. Journal of Yangzhou University, 2003, 24(4): 78-81. | |
| [11] | 王佳豪, 段雅倩, 乜兰春, 等. ‘羊角脆’类甜瓜果实品质因子分析及综合评价[J]. 中国农业科学, 2019, 52(24): 4582-4591. |
| WANG J H, DUAN Y Q, NIE L C, et al. Factor analysis and comprehensive evaluation of the fruit quality of ‘Yangjiaocui’ melons[J]. Scientia Agricultura Sinica, 2019, 52(24): 4582-4591. | |
| [12] | 汪颖, 王尖, 冯子珊, 等. 瓠瓜果实品质性状因子分析和综合评价[J]. 浙江农业学报, 2024, 36(2): 334-343. |
| WANG Y, WANG J, FENG Z S, et al. Factor analysis and comprehensive evaluation of the fruit quality of bottle gourd (Lagenaria siceraria)[J]. Acta Agriculturae Zhejiangensis, 2024, 36(2): 334-343. | |
| [13] | 尹玲, 王长林, 王迎杰, 等. 南瓜的感官品质、质构及生化分析[J]. 食品科学, 2013, 34(5): 26-30. |
| YIN L, WANG C L, WANG Y J, et al. Sensory quality, texture and chemical composition analysis of pumpkin[J]. Food Science, 2013, 34(5): 26-30. | |
| [14] | 高俊凤. 植物生理学实验指导[M]. 北京: 高等教育出版社, 2006. |
| [15] | 刘襄河, 郑丽璇, 郑丽勉, 等. 双波长法测定常用淀粉原料中直链淀粉、支链淀粉及总淀粉含量[J]. 广东农业科学, 2013, 40(18): 97-100. |
| LIU X H, ZHENG L X, ZHENG L M, et al. Determination of amylose and amylopectin in the commonly used starch materials by dual-wavelength spectrophotometry[J]. Guangdong Agricultural Sciences, 2013, 40(18): 97-100. | |
| [16] | 吴明隆. SPSS统计应用实务[M]. 北京: 中国铁道出版社, 2000. |
| [17] | 公丽艳, 孟宪军, 刘乃侨, 等. 基于主成分与聚类分析的苹果加工品质评价[J]. 农业工程学报, 2014, 30(13): 276-285. |
| GONG L Y, MENG X J, LIU N Q, et al. Evaluation of apple quality based on principal component and hierarchical cluster analysis[J]. Transactions of the Chinese Society of Agricultural Engineering, 2014, 30(13): 276-285. | |
| [18] | 杨鹏鸣, 李桂荣, 李孝伟, 等. 南瓜主要营养品质性状的变异及相关性研究[J]. 中国农学通报, 2006, 22(2): 285-288. |
| YANG P M, LI G R, LI X W, et al. Investigation on variation and correlation of pumpkin’s main quality traits[J]. Chinese Agricultural Science Bulletin, 2006, 22(2): 285-288. | |
| [19] | JUDITH M T, EMMANUEL Y, BALOGOUN I, et al. Agromorphological, chemical and biochemical characterization of pumpkin (Cucurbita maxima and Cucurbita moschata, Cucurbitaceae) morphotypes cultivated in Cameroon[J]. Research in Plant Sciences, 2015, 3(1): 12-17. |
| [20] | KISTLER L, NEWSOM L A, RYAN T M, et al. Gourds and squashes (Cucurbita spp.) adapted to megafaunal extinction and ecological anachronism through domestication[J]. Proceedings of the National Academy of Sciences of the United States of America, 2015, 112(49): 15107-15112. |
| [21] | XU Y C, WANG M M, ABBAS H M K, et al. Comparing the differences in quality profiles and antioxidant activity in seven pumpkin cultivars (Cucurbita moschata and Cucurbita maxima) at harvest and during postharvest storage[J]. Food Chemistry: X, 2024, 22: 101383. |
| [22] | 任晓婧. 印度南瓜淀粉和可溶性固形物含量性状的QTL定位分析[D]. 哈尔滨: 东北农业大学, 2021. |
| REN X J. QTL Mapping and analysis of starch and soluble solid content traits in pumpkin (Cucurbita maxima Duch.)[D]. Harbin: Northeast Agricultural University, 2021. | |
| [23] | 褚盼盼, 向长萍. 中国南瓜营养品质的变化规律和相关性[J]. 中国蔬菜, 2007(12): 15-19. |
| CHU P P, XIANG C P. Changes and correlation of nutritional quality of pumpkin in China[J]. China Vegetables, 2007(12): 15-19. |
| [1] | 张悦, 王镜然, 周强, 陈美玲, 王颜红. 外源喷施叶酸对稻米叶酸含量及品质的影响[J]. 浙江农业学报, 2026, 38(2): 197-205. |
| [2] | 欧阳宇, 刘朔, 李萌民, 张鹏. 轻量化改进的苹果园果实识别模型CS_YOLOv7[J]. 浙江农业学报, 2026, 38(2): 383-396. |
| [3] | 何苏悦, 李燕, 丁云倩, 李欣泽, 韩庆辉, 陈小央. 基于SSR标记的浙江省地方玉米种质遗传关系分析[J]. 浙江农业学报, 2026, 38(1): 24-34. |
| [4] | 王璐瑶, 周湘怡, 王国荣, 陈梦丽, 吴慧明. 爪哇虫草菌ZN-S21的培养特征及其对南亚果实蝇的室内杀虫活性[J]. 浙江农业学报, 2026, 38(1): 95-104. |
| [5] | 许卫猛, 徐妍, 陈国立. 基于多种分析方法的糯玉米品质综合评价[J]. 浙江农业学报, 2025, 37(9): 1840-1848. |
| [6] | 朱为静, 吴佳, 洪春来, 朱凤香, 洪磊东, 张涛, 张硕, 诸惠芬. 秸秆覆盖对土壤水热肥及蟠桃产量和品质的影响[J]. 浙江农业学报, 2025, 37(9): 1924-1932. |
| [7] | 贺世雄, 杨蕾, 齐安民, 程籍, 王敏, 李英奎, 洪林. 中间砧对3种杂柑叶片光合特性、理化指标和果实品质的影响[J]. 浙江农业学报, 2025, 37(8): 1680-1693. |
| [8] | 张顺昌, 徐继根, 符成悦, 蒲占湑, 胡丽鹏, 吴昊, 李俊兵, 辛亮, 雷元军. 喷施氨基酸钙对红美人杂柑果皮龟裂与品质的影响[J]. 浙江农业学报, 2025, 37(8): 1706-1715. |
| [9] | 严福林, 郎云虎, 简应权, 陈雄飞, 魏巍, 王志威, 安江勇, 任得强, 丁宁, 魏升华. 八爪金龙药材产量与品质对土壤理化性状的响应[J]. 浙江农业学报, 2025, 37(8): 1766-1775. |
| [10] | 王呈阳, 刘洁雅, 吴敏怡, 谢博伊, 洪德成, 冷锋, 吴国泉. 钙处理对涝害下寒香蜜葡萄果实品质的影响[J]. 浙江农业学报, 2025, 37(7): 1451-1458. |
| [11] | 张若楠, 门小明, 秦凯鹏, 王彬彬, 吴杰, 丁向彬, 徐子伟, 齐珂珂. 绿嘉黑猪的不同杂交组合生长性能、胴体品质、产肉性能和收益比较研究[J]. 浙江农业学报, 2025, 37(6): 1203-1211. |
| [12] | 陶鹏, 丁小雅, 岳智臣, 赵彦婷, 雷娟利, 胡齐赞, 臧运祥, 李必元. 南瓜果胶含量的全基因组关联分析与候选基因预测[J]. 浙江农业学报, 2025, 37(6): 1244-1251. |
| [13] | 项缨, 丛建民, 潘丹红, 陶永刚. 春大棚有机种植不同品种番茄的生育进程分析和综合评价研究[J]. 浙江农业学报, 2025, 37(6): 1252-1261. |
| [14] | 刘文琦, 胡齐赞, 岳智臣, 陶鹏, 雷娟利, 李必元, 赵彦婷, 王华森. 夏季高温对叶用芥菜外观与营养品质的影响[J]. 浙江农业学报, 2025, 37(6): 1262-1271. |
| [15] | 张程程, 范涛, 章检明, 赵风亮, 忻晓庭, 牛海月, 刘大群. 缙云梅干菜腌制过程中细菌群落与品质的变化[J]. 浙江农业学报, 2025, 37(6): 1336-1343. |
| 阅读次数 | ||||||
|
全文 |
|
|||||
|
摘要 |
|
|||||
