浙江农业学报 ›› 2026, Vol. 38 ›› Issue (4): 731-744.DOI: 10.3969/j.issn.1004-1524.20250738
生物炭-沼液配施对酸性红壤氮素转化的长期效应
应孟飞1( ), 管毅伦2, 靳泽文2,*(), 赵坤3, 平立凤2, 柴彦君2, 李艳4, 沈月5, 颜军5
- 1
绍兴市粮油作物技术推广中心 浙江 绍兴 312000
2浙江科技大学 环境与资源学院 ,浙江省废弃生物质循环利用与生态处理技术重点实验室 浙江 杭州 310023
3浙江树人学院 信息科技学院 浙江 杭州 310015
4浙江省农业科学院 环境资源与土壤肥料研究所 浙江 杭州 310021
5浙江省耕地质量与肥料管理总站 浙江 杭州 310020
-
收稿日期:2025-12-06出版日期:2026-04-25发布日期:2026-05-08 -
作者简介:靳泽文,E-mail:119044@zust.edu.cn
应孟飞,研究方向为生态能源。E-mail:172160949@qq.com -
通讯作者:靳泽文 -
基金资助:国家重点研发计划(2022YFE0196000)
Long-term effects of combined application of biochar and biogas slurry on nitrogen transformation in acidic red soil
YING Mengfei1(), GUAN Yilun2, JIN Zewen2,*(), ZHAO Kun3, PING Lifeng2, CHAI Yanjun2, LI Yan4, SHEN Yue5, YAN Jun5
- 1
Shaoxing Grain and Oil Crops Technology Promotion Center Shaoxing 312000, China
2Key Laboratory of Recycling and Eco-Treatment of Waste Biomass of Zhejiang Province ,School of Environment and Natural Resources, Zhejiang University of Science and Technology Hangzhou 310023, China
3College of Information Science and Technology ,Zhejiang Shuren University Hangzhou 310015, China
4Institute of Environment ,Resource, Soil and Fertilizer, Zhejiang Academy of Agricultural Sciences Hangzhou 310021, China
5Zhejiang Cultivated Land Quality and Fertilizer Administration Station Hangzhou 310020, China
-
Received:2025-12-06Published:2026-04-25Online:2026-05-08 -
Contact:JIN Zewen
摘要:
土壤酸化与氮素利用效率低下是制约我国南方农业可持续发展的关键瓶颈。本研究通过为期5年的长期田间定位试验,采用白菜-甘薯轮作制度,设置无肥对照(CK)、单施化肥(C0B0)、沼液替代化肥(C0B1)、生物炭配施化肥(C1B0)和生物炭配施沼液(C1B1)5个处理,系统探究了生物炭-沼液协同施用对酸性红壤氮素转化的影响。结果表明,生物炭-沼液配施对土壤酸度影响显著(p<0.05),经过5年处理后,C1B1处理的土壤pH值从初始的5.44提升至7.13,较C0B0处理提高2.05。与CK处理相比,C1B1处理脲酶活性显著升高30.0%,而硝酸还原酶和亚硝酸还原酶活性分别显著降低35.2%和36.3%,表明氮循环从“硝化-反硝化”主导模式转向“固氮-同化”主导模式。微生物群落分析显示,与C0B0处理相比,C1B1处理的固氮细菌相对丰度显著增加,而硝化细菌丰度显著下降。C1B1处理的白菜和甘薯5年平均产量分别为56.31、46.17 t·hm-2,白菜季和甘薯季的氮肥农学效率分别为234.4、220.4 kg·kg-1,均高于C0B0处理。结构方程模型揭示,pH是调控氮循环的核心驱动因子;随机森林模型结果表明,pH值6.5是氮素利用效率跃升的关键阈值。本研究证实,生物炭-沼液协同施用通过pH介导的多层次调控过程,实现了酸性红壤氮素转化的系统性优化,该技术可在保证产量的前提下大幅减少化肥投入,具有良好的经济与生态效益,为化肥减施增效提供了科学依据。
中图分类号:
引用本文
应孟飞, 管毅伦, 靳泽文, 赵坤, 平立凤, 柴彦君, 李艳, 沈月, 颜军. 生物炭-沼液配施对酸性红壤氮素转化的长期效应[J]. 浙江农业学报, 2026, 38(4): 731-744.
YING Mengfei, GUAN Yilun, JIN Zewen, ZHAO Kun, PING Lifeng, CHAI Yanjun, LI Yan, SHEN Yue, YAN Jun. Long-term effects of combined application of biochar and biogas slurry on nitrogen transformation in acidic red soil[J]. Acta Agriculturae Zhejiangensis, 2026, 38(4): 731-744.
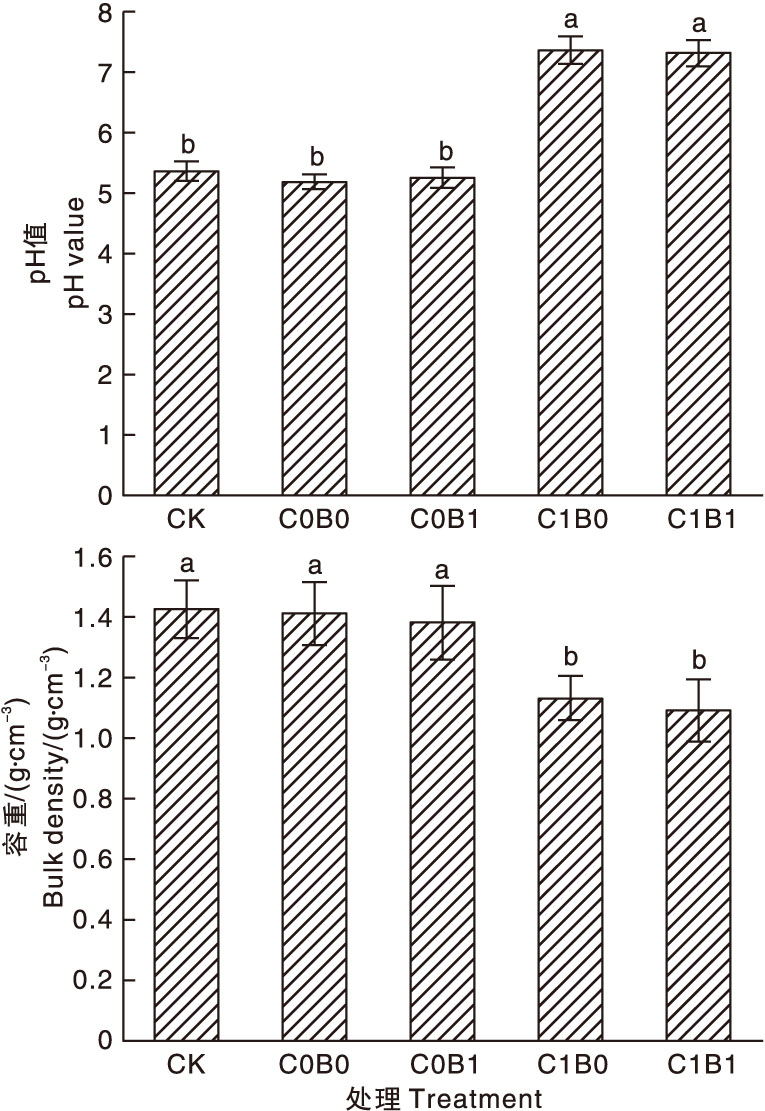
图1 生物炭和沼液处理下土壤的pH值和容重 柱上无相同字母的表示处理间差异显著(p<0.05)。下同。
Fig.1 Soil pH value and bulk density under biochar and biogas slurry treatments Bars marked without the same letters indicate significant difference at p<0.05. The same as below.
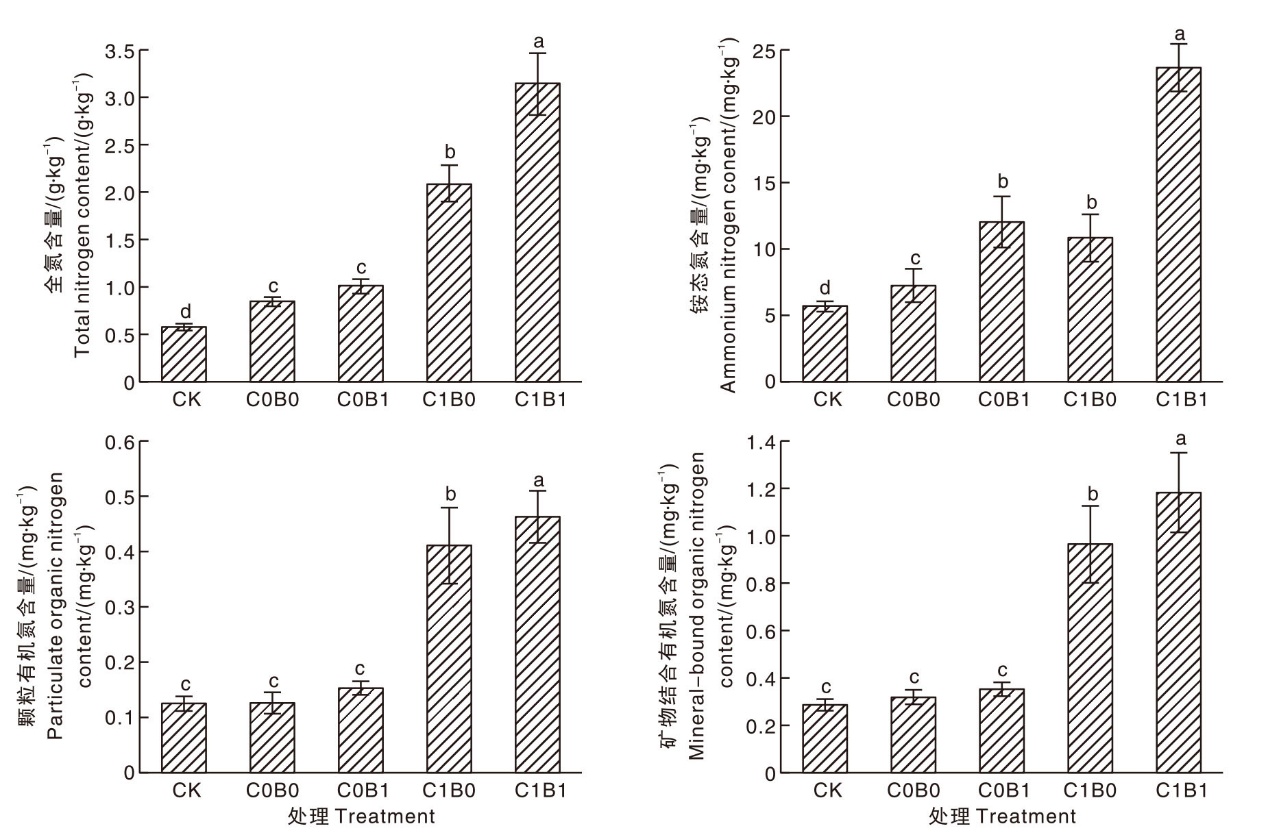
图2 生物炭和沼液处理下土壤的全氮、铵态氮、颗粒有机氮(PON)和矿物结合有机氮(MAON)含量
Fig.2 Contents of soil total nitrogen, ammonium nitrogen, particulate organic nitrogen (PON) and mineral-associated organic nitrogen (MAON) under biochar and biogas slurry treatments
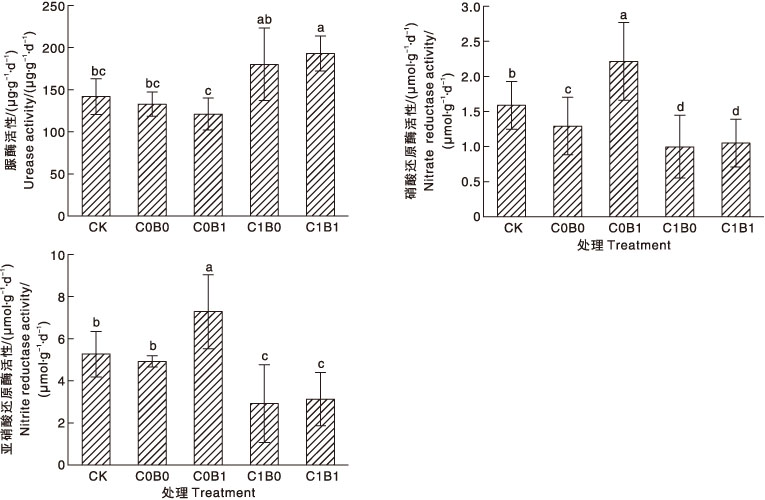
图3 生物炭和沼液处理下土壤的脲酶、硝酸还原酶和亚硝酸还原酶活性
Fig.3 Activities of soil urease, nitrate reductase and nitrite reductase under biochar and biogas slurry treatments
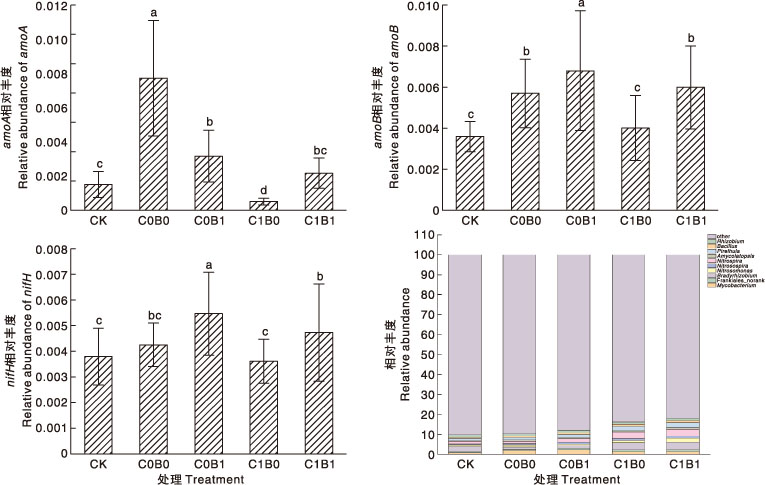
图4 生物炭和沼液处理下土壤的功能基因丰度和微生物相对丰度 Other,其他;Rhizobium,根据瘤菌属;Bacillus,芽孢杆菌属;Pirellula,小梨形菌属;Amycolatopsis,拟无枝酸菌属;Nitrospira,硝化螺菌属;Nitrosospira,亚硝化螺菌属;Nitrosomonas,亚硝化单胞菌属;Bradyrhizobium,慢生根瘤菌属;Frankiales_norank,弗兰克氏菌目_未分类;Mycobacterium,分枝杆菌属。
Fig.4 Soil functional genes abundance and microbial relative abundance under biochar and biogas slurry treatments
| 处理 Treatment | 历年产量r/(t·hm-2) Yield in each year/(t·hm-2) | AEN/(kg· kg-1) | |||||
|---|---|---|---|---|---|---|---|
| 2020 | 2021 | 2022 | 2023 | 2024 | 平均值Mean | ||
| CK | 4.38±0.31 c | 5.03±0.44 c | 4.07±0.56 c | 3.61±0.27 c | 2.14±0.44 c | 3.85±0.38 c | 0 |
| C0B0 | 21.67±2.42 b | 22.34±1.34 b | 23.09±2.65 b | 19.28±1.24 b | 15.71±2.39 b | 20.42±2.01 b | 86.3 |
| C0B1 | 25.22±3.20 b | 23.90±2.21 b | 22.28±2.37 b | 21.39±2.26 b | 16.07±1.73 b | 21.77±2.24 b | 93.3 |
| C1B0 | 47.58±3.76 a | 46.92±4.32 a | 47.05±6.64 a | 46.39±4.28 a | 42.09±4.32 a | 46.00±5.35 a | 219.5 |
| C1B1 | 49.76±5.25 a | 46.82±3.36 a | 46.40±4.32 a | 44.83±5.76 a | 43.06±2.28 a | 46.17±3.98 a | 220.4 |
表1 生物炭和沼液处理下甘薯的产量和氮肥农学效率(AEN)
Table 1 Yield and agronomic efficiency of nitrogen (AEN) of sweet potato under biochar and biogas slurry treatments
| 处理 Treatment | 历年产量r/(t·hm-2) Yield in each year/(t·hm-2) | AEN/(kg· kg-1) | |||||
|---|---|---|---|---|---|---|---|
| 2020 | 2021 | 2022 | 2023 | 2024 | 平均值Mean | ||
| CK | 4.38±0.31 c | 5.03±0.44 c | 4.07±0.56 c | 3.61±0.27 c | 2.14±0.44 c | 3.85±0.38 c | 0 |
| C0B0 | 21.67±2.42 b | 22.34±1.34 b | 23.09±2.65 b | 19.28±1.24 b | 15.71±2.39 b | 20.42±2.01 b | 86.3 |
| C0B1 | 25.22±3.20 b | 23.90±2.21 b | 22.28±2.37 b | 21.39±2.26 b | 16.07±1.73 b | 21.77±2.24 b | 93.3 |
| C1B0 | 47.58±3.76 a | 46.92±4.32 a | 47.05±6.64 a | 46.39±4.28 a | 42.09±4.32 a | 46.00±5.35 a | 219.5 |
| C1B1 | 49.76±5.25 a | 46.82±3.36 a | 46.40±4.32 a | 44.83±5.76 a | 43.06±2.28 a | 46.17±3.98 a | 220.4 |
| 处理 Treatment | 历年产量/(t·hm-2) Yield in each year/(t·hm-2) | AEN/(kg· kg-1) | |||||
|---|---|---|---|---|---|---|---|
| 2020 | 2021 | 2022 | 2023 | 2024 | 平均值Mean | ||
| CK | 3.16±0.34 c | 3.51±0.28 c | 2.90±0.25 c | 3.67±0.43 c | 3.39±0.52 c | 3.33±0.46 c | 0 |
| C0B0 | 43.65±3.35 b | 36.49±3.56 b | 32.86±2.28 b | 27.36±2.29 b | 20.31±3.34 b | 32.13±2.89 b | 127.4 |
| C0B1 | 46.55±4.48 b | 41.11±7.21 b | 36.72±3.56 b | 33.78±4.21 b | 25.92±3.25 b | 36.82±4.43 b | 148.1 |
| C1B0 | 64.01±5.27 a | 58.24±6.25 a | 51.31±4.89 a | 52.44±3.56 a | 45.45±5.56 a | 54.29±4.76 a | 225.5 |
| C1B1 | 66.11±6.12 a | 60.56±5.73 a | 55.26±5.56 a | 52.27±6.25 a | 47.37±5.23 a | 56.31±5.48 a | 234.4 |
表2 生物炭和沼液处理下白菜的产量和氮肥农学效率(AEN)
Table 2 Yield and agronomic efficiency of nitrogen (AEN) of Chinese cabbage under biochar and biogas slurry treatments
| 处理 Treatment | 历年产量/(t·hm-2) Yield in each year/(t·hm-2) | AEN/(kg· kg-1) | |||||
|---|---|---|---|---|---|---|---|
| 2020 | 2021 | 2022 | 2023 | 2024 | 平均值Mean | ||
| CK | 3.16±0.34 c | 3.51±0.28 c | 2.90±0.25 c | 3.67±0.43 c | 3.39±0.52 c | 3.33±0.46 c | 0 |
| C0B0 | 43.65±3.35 b | 36.49±3.56 b | 32.86±2.28 b | 27.36±2.29 b | 20.31±3.34 b | 32.13±2.89 b | 127.4 |
| C0B1 | 46.55±4.48 b | 41.11±7.21 b | 36.72±3.56 b | 33.78±4.21 b | 25.92±3.25 b | 36.82±4.43 b | 148.1 |
| C1B0 | 64.01±5.27 a | 58.24±6.25 a | 51.31±4.89 a | 52.44±3.56 a | 45.45±5.56 a | 54.29±4.76 a | 225.5 |
| C1B1 | 66.11±6.12 a | 60.56±5.73 a | 55.26±5.56 a | 52.27±6.25 a | 47.37±5.23 a | 56.31±5.48 a | 234.4 |
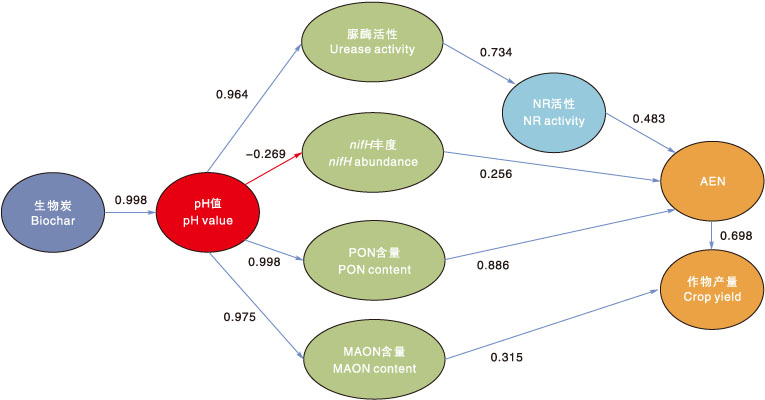
图5 生物炭调控下土壤pH值对氮素转化、土壤性质及作物产量的结构方程模型 图中椭圆代表模型中的观测/潜变量,包括外源驱动变量(生物炭)、中介调控变量[土壤pH值、脲酶活性、硝酸还原酶(NR)活性、固氮功能基因nifH的(相对)丰度、颗粒有机氮(PON)含量、矿物结合有机氮(MAON)含量],及目标响应变量[氮肥农学效率(AEN)、作物产量]。箭头表示变量间的因果路径,线上数值为标准化路径系数,绝对值大小反映作用强度,箭头方向代表作用方向[蓝色箭头为正向显著(p<0.05)路径,红色箭头为负向显著路径]。
Fig.5 Structural equation model of soil pH value under biochar regulation on nitrogen transformation, soil properties and crop yield Ellipses represent observed/latent variables: exogenous driver (biochar), mediators [soil pH value, urease activity, nitrate reductase (NR) activity, (relative) abundance of nitrogen-fixing functional gene nifH, particulate organic nitrogen (PON) content, mineral-associated organic nitrogen (MAON) content], and responses [agronomic efficiency of nitrogen (AEN), crop yield]. Arrows indicate the causal paths between variables. The values on the lines are standardized path coefficients, and the absolute value reflects the strength of the effect. The direction of the arrow represents the direction of the effect [blue arrows are significantly (p<0.05) positive paths, red arrow is significantly negative path].
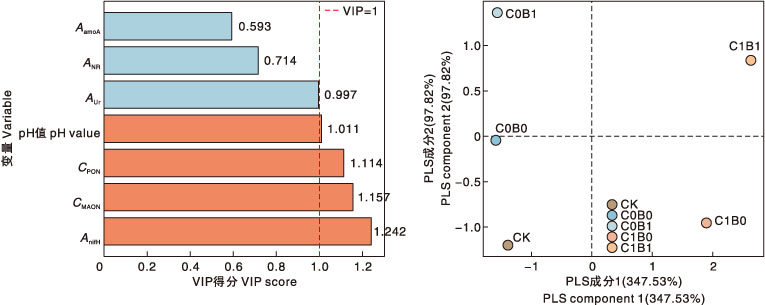
图6 影响作物产量与氮肥农学效率的偏最小二乘回归(PLS)分析 AamoA,amoA的相对丰度;ANR,硝酸还原酶活性;AUr,脲酶活性;cPON,颗粒有机氮含量;cMAON,矿物结合有机氮含量;AnifH,nifH的相对丰度。下同。左图为PLS变量重要性(VIP得分),红色虚线为VIP=1阈值(VIP>1的变量对模型解释更重要);右图为PLS成分得分图。
Fig.6 Partial least squares regression (PLS) analysis of factors influencing crop yield and agronomic efficiency of nitrogen AamoA, Relative abundance of amoA gene; ANR, Nitrate reductase activity; AUr, Urease activity; cPON, Particulate organic nitrogen content; cMAON, Mineral-associated organic nitrogen content; AnifH, Relative abundance of nifH gene. The same as below. Left panel shows PLS variable importance (VIP score), with the red dashed line indicating the VIP=1 threshold (variables with VIP>1 contribute more to model explanation). Right panel shows PLS component score plot.
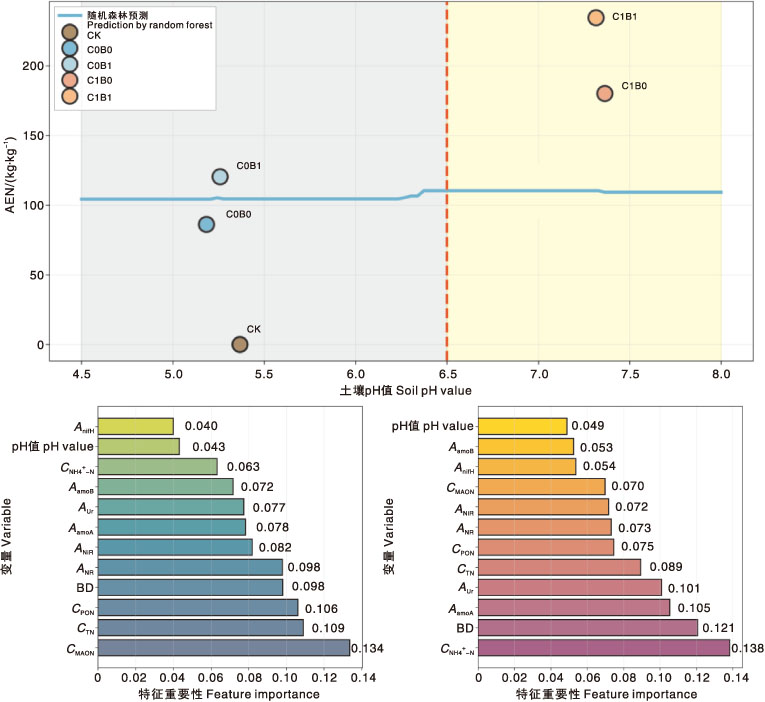
图7 随机森林模型识别影响氮肥农学效率(AEN)的重要变量及其相对重要性 ${c}_{\mathrm{N}{\mathrm{H}}_{4}^{+}\mathrm{-}\mathrm{N}}$,铵态氮含量;AamoB,amoB的相对丰度;ANiR,亚硝酸还原酶活性;BD,容重;cTN,全氮含量。下同。上图为随机森林预测曲线,展示土壤pH值与氮肥农学效率(AEN)的关系,红色虚线为pH值6.5关键阈值,左侧灰色区域为酸性区(pH值<6.5),右侧黄色区域为中性-碱性区(pH值>6.5);下图左侧为氮肥农学效率的特征重要性排序(决定系数为0.916 1),下图右侧为作物产量的特征重要性排序(决定系数为0.765 5)。
Fig.7 Important variables identified by random forest model affecting agronomic efficiency of nitrogen (AEN) and their relative importance ${c}_{\mathrm{N}{\mathrm{H}}_{4}^{+}\mathrm{-}\mathrm{N}}$, Ammonium nitrogen content; AamoB, Relative abundance of amoB gene; ANiR, Nitrite reductase activity; BD, Bulk density; cTN, Total nitrogen content. The same as below.Top panel shows the random forest prediction curve illustrating the relationship between soil pH value and agronomic efficiency of nitrogen (AEN). The red dashed line in the top panel indicates the critical threshold of pH value of 6.5, with the left gray area representing the acidic region (pH value<6.5) and the right yellow area representing the neutral-alkaline region (pH value >6.5). The left part of the bottom panel shows the feature importance ranking for agronomic efficiency of nitrogen (determination coefficient of 0.916 1). The right part of the bottom panel shows the feature importance ranking for crop yield (determination coefficient of 0.765 5).
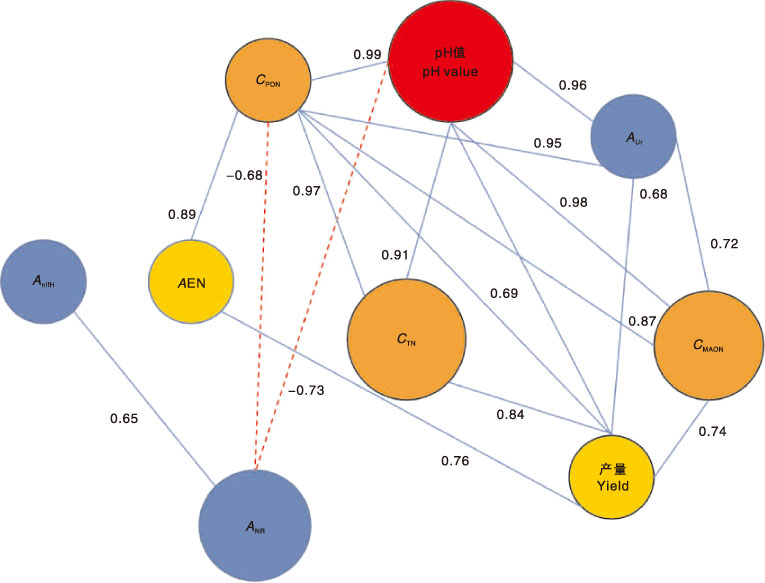
图8 土壤pH值介导的氮循环过程、酶活性、氮素形态与作物产量、氮肥农学效率(AEN)的相关性网络图 节点代表土壤氮素转化相关变量,节点大小表示变量重要性,连线表示变量间的相关性,蓝色实线为正相关(r>0.6),红色虚线为负相关(r<-0.6),线上数值为相关系数。
Fig.8 The correlation network diagram of the nitrogen cycling process, enzyme activity, nitrogen forms, and crop yield, agronomic efficiency of nitrogen (AEN) mediated by soil pH value Nodes represent variables related to soil nitrogen transformation. Node size indicates variable importance. Lines represent correlations between variables: blue solid lines for positive correlations (r>0.6), red dashed lines for negative correlations (r<-0.6), with values on lines indicating correlation coefficients.
| [1] | ZAMAN M, SAGGAR S, BLENNERHASSETT J D, et al. Effect of urease and nitrification inhibitors on N transformation, gaseous emissions of ammonia and nitrous oxide, pasture yield and N uptake in grazed pasture system[J]. Soil Biology and Biochemistry, 2009, 41(6): 1270-1280. |
| [2] | HE G, WANG Z H, LI F C, et al. Soil nitrate-N residue, loss and accumulation affected by soil surface management and precipitation in a winter wheat-summer fallow system on dryland[J]. Nutrient Cycling in Agroecosystems, 2016, 106(1): 31-46. |
| [3] | JU X T, XING G X, CHEN X P, et al. Reducing environmental risk by improving N management in intensive Chinese agricultural systems[J]. Proceedings of the National Academy of Sciences of the United States of America, 2009, 106(9): 3041-3046. |
| [4] | CHEN X P, CUI Z L, FAN M S, et al. Producing more grain with lower environmental costs[J]. Nature, 2014, 514(7523): 486-489. |
| [5] | GUO J H, LIU X J, ZHANG Y, et al. Significant acidification in major Chinese croplands[J]. Science, 2010, 327(5968): 1008-1010. |
| [6] | MENG C, TIAN D S, ZENG H, et al. Global soil acidification impacts on belowground processes[J]. Environmental Research Letters, 2019, 14(7): 074003. |
| [7] | KOCHIAN L V, HOEKENGA O A, PINEROS M A. How do crop plants tolerate acid soils?: mechanisms of aluminum tolerance and phosphorous efficiency[J]. Annual Review of Plant Biology, 2004, 55: 459-493. |
| [8] | SINGH R, NYE P H. The effect of soil pH and high urea concentrations on urease activity in soil[J]. Journal of Soil Science, 1984, 35(4): 519-527. |
| [9] | ZHANG L M, HU H W, SHEN J P, et al. Ammonia-oxidizing archaea have more important role than ammonia-oxidizing bacteria in ammonia oxidation of strongly acidic soils[J]. The ISME Journal, 2012, 6(5): 1032-1045. |
| [10] | GRUBER N, GALLOWAY J N. An earth-system perspective of the global nitrogen cycle[J]. Nature, 2008, 451(7176): 293-296. |
| [11] | KUYPERS M M M, MARCHANT H K, KARTAL B. The microbial nitrogen-cycling network[J]. Nature Reviews Microbiology, 2018, 16(5): 263-276. |
| [12] | 隋倩雯, 董红敏, 朱志平, 等. 沼液深度处理技术研究与应用现状[J]. 中国农业科技导报, 2011, 13(1): 83-87. |
| SUI Q W, DONG H M, ZHU Z P, et al. Present status of biogas effluent treatment technology research and application[J]. Journal of Agricultural Science and Technology, 2011, 13(1): 83-87. | |
| [13] | WANG Z C, SANUSI I A, WANG J D, et al. Biogas slurry significantly improved degraded farmland soil quality and promoted Capsicum spp. production[J]. Plants, 2024, 13(2): 265. |
| [14] | TANG Y F, LUO L M, CARSWELL A, et al. Changes in soil organic carbon status and microbial community structure following biogas slurry application in a wheat-rice rotation[J]. Science of the Total Environment, 2021, 757: 143786. |
| [15] | 陈彪, 陈晓晨, 肖艳春, 等. 沼液生物熟化及资源化安全利用调控技术研究与应用[J]. 中国科技成果, 2018(13): 65-66. |
| CHEN B, CHEN X C, XIAO Y C, et al. Research and application of control technology for biological maturation and safe resource utilization of biogas slurry[J]. China Science and Technology Achievements, 2018(13): 65-66. | |
| [16] | LEHMANN E, JOSEPH S. Biochar for environmental management[M]. London: Earthscan, 2009. |
| [17] | SONG Y Z, LI Y F, CAI Y J, et al. Biochar decreases soil N2O emissions in Moso bamboo plantations through decreasing labile N concentrations, N-cycling enzyme activities and nitrification/denitrification rates[J]. Geoderma, 2019, 348: 135-145. |
| [18] | LONG, X X, YU Z N, LIU S, et al. A systematic review of biochar aging and the potential eco-environmental risk in heavy metal contaminated soil[J]. Journal of Hazardous Materials, 2024, 472: 134345. |
| [19] | QUAN G X, FAN Q Y, ZIMMERMAN A R, et al. Effects of laboratory biotic aging on the characteristics of biochar and its water-soluble organic products[J]. Journal of Hazardous Materials, 2020, 382: 121071. |
| [20] | GUL S, WHALEN J K, THOMAS B W, et al. Physico-chemical properties and microbial responses in biochar-amended soils: mechanisms and future directions[J]. Agriculture, Ecosystems & Environment, 2015, 206: 46-59. |
| [21] | 鲁如坤. 土壤农业化学分析方法[M]. 北京: 中国农业科学技术出版社, 2000. |
| [22] | 郑慧芬, 吴红慧, 翁伯琦, 等. 施用生物炭提高酸性红壤茶园土壤的微生物特征及酶活性[J]. 中国土壤与肥料, 2019(2): 68-74. |
| ZHENG H F, WU H H, WENG B Q, et al. Improved soil microbial characteristics and enzyme activities with wheat straw biochar addition to an acid tea plantation in red soil[J]. Soils and Fertilizers Sciences in China, 2019(2): 68-74. | |
| [23] | 李双双, 陈晨, 段鹏鹏, 等. 生物质炭对酸性菜地土壤N2O排放及相关功能基因丰度的影响[J]. 植物营养与肥料学报, 2018, 24(2): 414-423. |
| LI S S, CHEN C, DUAN P P, et al. Effects of biochar application on N2O emissions and abundance of nitrogen related functional genes in an acidic vegetable soil[J]. Journal of Plant Nutrition and Fertilizers, 2018, 24(2): 414-423. (in Chinese with English abstract) | |
| [24] | 张文康, 陈渠东, 姚光伟, 等. 生物质炭-沼液联用对土壤微生物及碳氮功能基因的影响[J]. 环境化学, 2026, 45(2): 527-537. |
| ZHANG W K, CHEN Q D, YAO G W, et al. Effects of biochar-biogas slurry application on soil microorganisms and functional genes[J]. Environmental Chemistry, 2026, 45(2): 527-537. | |
| [25] | CHINTALA R, MOLLINEDO J, SCHUMACHER T E, et al. Effect of biochar on chemical properties of acidic soil[J]. Archives of Agronomy and Soil Science, 2014, 60(3): 393-404. |
| [26] | 许云翔, 何莉莉, 刘玉学, 等. 施用生物炭6年后对稻田土壤酶活性及肥力的影响[J]. 应用生态学报, 2019, 30(4): 1110-1118. |
| XU Y X, HE L L, LIU Y X, et al. Effects of biochar addition on enzyme activity and fertility in paddy soil after six years[J]. Chinese Journal of Applied Ecology, 2019, 30(4): 1110-1118. (in Chinese) | |
| [27] | WANG J Y, RIAZ M, BABAR S, et al. Iron-modified biochar reduces nitrogen loss and improves nitrogen retention in Luvisols by adsorption and microbial regulation[J]. Science of the Total Environment, 2023, 879: 163196. |
| [28] | LUO S S, WANG S J, TIAN L, et al. Long-term biochar application influences soil microbial community and its potential roles in semiarid farmland[J]. Applied Soil Ecology, 2017, 117: 10-15. |
| [29] | JIN Z W, CHEN C, CHEN X M, et al. Soil acidity, available phosphorus content, and optimal biochar and nitrogen fertilizer application rates: a five-year field trial in upland red soil, China[J]. Field Crops Research, 2019, 232: 77-87. |
| [30] | VAN DEN HEUVEL R N, BAKKER S E, JETTEN M S M, et al. Decreased N2O reduction by low soil pH causes high N2O emissions in a riparian ecosystem[J]. Geobiology, 2011, 9(3): 294-300. |
| [31] | LIN Y X, YE G P, LIU D Y, et al. Long-term application of lime or pig manure rather than plant residues suppressed diazotroph abundance and diversity and altered community structure in an acidic Ultisol[J]. Soil Biology and Biochemistry, 2018, 123: 218-228. |
| [32] | 杜臻杰, 齐学斌, 陈效民, 等. 生物质炭和猪场沼液对潮土水力特征参数的影响[J]. 水土保持学报, 2014, 28(1): 189-192. |
| DU Z J, QI X B, CHEN X M, et al. Effect of biochar and piggery biogas slurry on hydraulic characteristic parameter of alluvial soil[J]. Journal of Soil and Water Conservation, 2014, 28(1): 189-192. |
| [1] | 巴仕浩, 童文彬, 杨海峻, 江建锋, 李子川, 吴春艳, 唐旭, 柴彦君, 李艳. 沼液施用协同化肥减量在茭白生产和土壤改良上的效果[J]. 浙江农业学报, 2026, 38(1): 126-135. |
| [2] | 苏扬, 商小兰, 钱忠明, 吴林根, 黄佳琦, 庄海峰, 赵宇飞, 党洪阳, 徐立军. 腐熟剂与生物炭协同强化秸秆还田对土壤质量和水稻生长的影响[J]. 浙江农业学报, 2025, 37(5): 1139-1148. |
| [3] | 应永飞, 韩东轩, 孟芳, 俞遴, 沈佳栾, 汪开英. 沼液替代化肥对水稻产量、品质和土壤特性的影响[J]. 浙江农业学报, 2025, 37(4): 880-891. |
| [4] | 武佳龙, 迟铭, 高燕, 王祥, 沈海鸥. 施加生物炭对黑土区坡耕地土壤主要理化指标的动态影响[J]. 浙江农业学报, 2024, 36(9): 2060-2069. |
| [5] | 傅志强, 刘祯, 马春花, 温梦玲, 奚如春. 生物炭及炭基肥对土壤质量与植物生长的影响[J]. 浙江农业学报, 2024, 36(7): 1634-1645. |
| [6] | 俞朝, 王音予, 刘奇珍, 王芸, 沈泓, 冯英. 不同原料生物炭与无机钝化剂配施对小白菜地上部镉积累和土壤镉钝化的影响[J]. 浙江农业学报, 2024, 36(3): 613-621. |
| [7] | 马玲, 张镇武, 方英姿, 吴慧欣, 邢承华. 减氮配施生物炭对椪柑生长发育与土壤特性的影响[J]. 浙江农业学报, 2024, 36(12): 2739-2747. |
| [8] | 吴雨珂, 王峰, 王依凡, 吴雪萍, 朱维琴. 牛粪蚯蚓堆肥条件优化与堆制物的性状变化[J]. 浙江农业学报, 2024, 36(10): 2308-2315. |
| [9] | 韩静, 朱依婷, 郑驰, 马莉红, 张亚男, 曾秋艳, 刘书亮, 陈姝娟. 毛豆壳生物炭的活化及其对甲萘威的吸附性能[J]. 浙江农业学报, 2023, 35(9): 2202-2211. |
| [10] | 肖华, 徐杏, 谢传奇, 周昕, 周卫东, 唐文升. 鸟粪石沉淀预处理对猪场沼液双膜浓缩工艺的影响[J]. 浙江农业学报, 2023, 35(6): 1407-1415. |
| [11] | 徐洋, 任奕林, 王浩杰, 黄秋航, 邢博源, 曹红亮. 不同制备条件下油菜秸秆生物炭用作缓释载体的综合评价[J]. 浙江农业学报, 2023, 35(4): 893-902. |
| [12] | 阮泽斌, 王兰鸽, 蓝王凯宁, 徐彦, 陈俊辉, 柳丹. 氮肥减量配施生物炭对水稻氮素吸收和土壤理化性质的影响[J]. 浙江农业学报, 2023, 35(2): 394-402. |
| [13] | 王薇薇, 梅燚, 吴永成, 万红建, 陈长军, 郑青松, 郑佳秋. 玉米芯生物炭对辣椒连作土壤性质和辣椒生长的影响[J]. 浙江农业学报, 2023, 35(1): 156-163. |
| [14] | 崔文芳, 陈静, 鲁富宽, 秦丽, 秦德志, 王利平, 高聚林. 生物炭结合氮肥减量对玉米产量和氮效率的影响[J]. 浙江农业学报, 2022, 34(2): 248-254. |
| [15] | 林智文, 张鹏, 吴天昊, 单颖, 邹刚华, 赵凤亮, 郑桂萍. 秸秆直接还田与炭化还田对热带土壤-水稻系统氨挥发的影响[J]. 浙江农业学报, 2022, 34(12): 2689-2699. |
| 阅读次数 | ||||||
|
全文 |
|
|||||
|
摘要 |
|
|||||
